
A service business can have plenty of technicians and still struggle with capacity.
The problem is not always:
not enough people.
Sometimes the real problem is:
too much paid time that never becomes productive customer work.
Technicians lose time through:
- driving;
- waiting;
- no-shows;
- poor routing;
- material collection;
- unclear job information;
- paperwork;
- schedule gaps;
- late starts;
- overlong meetings.
That means a company can hire another technician when the better first move would have been to use its existing team more efficiently.
This is why learning how to improve technician utilization matters.
A strong utilization system looks like:
Available Technician Hours
↓
Remove Avoidable Downtime
↓
Improve Scheduling
↓
Reduce Travel
↓
Prepare Jobs Properly
↓
Increase Productive Hours
↓
Complete More Profitable Work
The goal is not to make technicians work faster every minute of the day.
It is to remove waste from the system around them.
What Is Technician Utilization?
Technician utilization measures how much available technician time is spent on productive work.
A simple formula is:
Productive Hours ÷ Available Hours × 100
For example:
A technician is available for:
40 hours per week
and spends:
28 hours
on billable or productive customer work.
Utilization:
28 ÷ 40 × 100 = 70%
The remaining 12 hours may include:
- travel;
- admin;
- idle time;
- meetings;
- material collection;
- training.
Not all non-billable time is bad.
The goal is to identify which parts are:
necessary
and which are:
avoidable.
Billable Hours vs Productive Hours
These terms are related but not identical.
Billable Hours
Time directly charged to customers.
Productive Hours
Time that contributes meaningfully to service delivery.
For example:
A technician may spend 15 minutes preparing parts for a job.
That time may not be directly billed.
But it is still productive.
This is why your business should define exactly what counts.
Why Utilization Matters
Technician time is one of the most expensive resources in many service businesses.
You already pay for:
- wages;
- insurance;
- vehicle;
- fuel;
- tools;
- software;
- training.
If large portions of the day are unproductive, your cost per completed job increases.
Better utilization can improve:
- revenue;
- gross profit;
- response time;
- schedule capacity.
Without hiring another person.
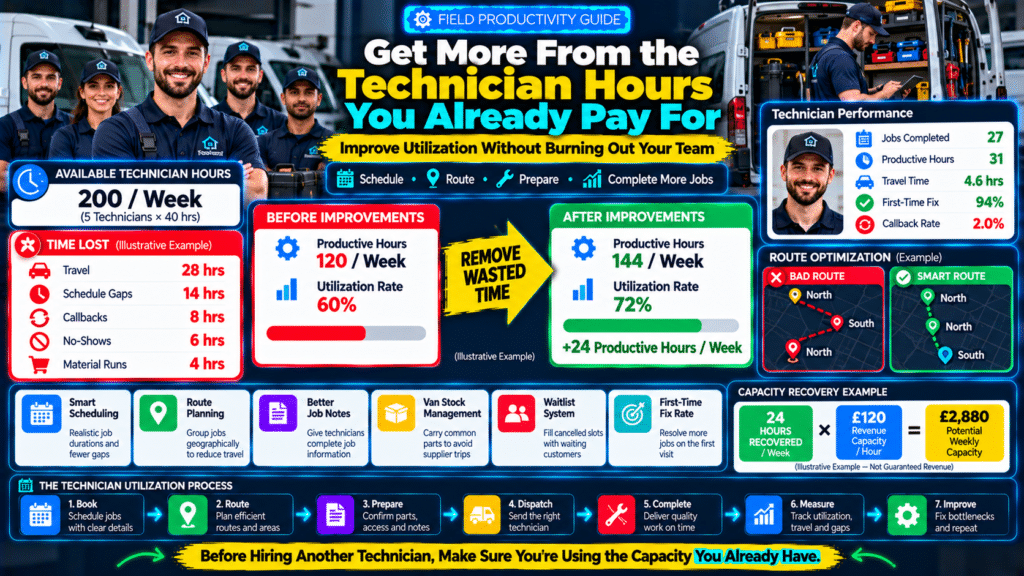
Example
Suppose you have:
5 technicians
Each technician works:
40 hours per week.
Total available capacity:
200 hours.
If average utilization is:
60%
productive time:
120 hours.
If you improve utilization to:
72%
productive time becomes:
144 hours.
That is:
24 additional productive hours per week
without hiring anyone.
That can equal several extra jobs.
Do Not Aim for 100% Utilization
This is important.
A technician cannot realistically spend every paid minute inside a customer’s property.
They need time for:
- travel;
- breaks;
- documentation;
- training;
- vehicle checks.
Trying to force utilization toward 100% can create:
- rushed work;
- callbacks;
- burnout;
- poor customer service.
The goal is:
healthy productive utilization
not:
maximum pressure.
Step 1: Measure Where Time Goes
Before improving utilization, understand the current day.
Track technician time in broad categories.
For example:
- customer work;
- travel;
- waiting;
- admin;
- material collection;
- meetings;
- unassigned gaps.
Example Technician Day
8:00–8:30
Vehicle prep.
8:30–9:00
Travel.
9:00–10:30
Job.
10:30–11:10
Travel.
11:10–11:40
Waiting for customer.
11:40–12:30
Job.
12:30–1:00
Lunch.
1:00–1:50
Material collection.
1:50–2:30
Travel.
2:30–4:00
Job.
4:00–4:30
Admin.
The technician worked all day.
But customer work totaled only around:
4 hours 50 minutes.
The issue is not technician effort.
The issue is system design.
Step 2: Reduce Travel Time
Travel is one of the biggest utilization losses in field service.
A poorly planned schedule might look like:
North side
↓
South side
↓
North side again
This wastes:
- time;
- fuel;
- vehicle capacity.
Group jobs geographically where possible.
Example
Instead of:
Job 1 — North
Job 2 — South
Job 3 — North
schedule:
Job 1 — North
Job 3 — North
Job 2 — South
Even simple route logic can save substantial time.
Use Service Areas
Define:
- primary service area;
- extended service area;
- out-of-area pricing or restrictions.
A business that accepts every distant job may stay busy but become inefficient.
Travel has a cost.
Step 3: Build Better Appointment Windows
Schedules fail when jobs are given unrealistic durations.
If a common service actually takes:
90 minutes
but the calendar allocates:
60 minutes
the technician falls behind.
Then every later job suffers.
Use historical data.
Compare:
scheduled duration
with:
actual duration.
Update standard job times.
Example
You discover:
Boiler Service
Scheduled:
60 minutes.
Actual average:
78 minutes.
Change schedule block to:
80–90 minutes.
This may look like fewer jobs on paper.
But the day becomes more reliable.
Step 4: Reduce Schedule Gaps
A 45-minute gap between jobs may not be enough for another full appointment.
But it is still expensive.
Look for repeated gaps such as:
- 30 minutes;
- 45 minutes;
- 1 hour.
Then identify whether they result from:
- poor booking;
- travel;
- cancellations.
Use Short Jobs to Fill Gaps
Maintain a list of flexible work such as:
- inspections;
- minor repairs;
- estimates;
- nearby follow-ups.
If a slot opens, dispatch can fill it.
Step 5: Build a Waitlist
A waitlist helps recover:
- cancellations;
- no-shows;
- early job completions.
Customers can opt into:
Contact me if something becomes available sooner.
Then when a slot opens:
Cancellation
↓
Check Nearby Waitlist
↓
Offer Slot
↓
Schedule Filled
This connects directly with your no-show prevention process.
Step 6: Reduce No-Shows
Every no-show damages utilization.
Technician travel and waiting produce no billable result.
Use:
- booking confirmation;
- reminders;
- on-my-way messages;
- deposits where appropriate;
- easy rescheduling.
Reducing no-shows improves utilization immediately.
Step 7: Prepare Jobs Before Dispatch
Technicians lose time when they arrive without:
- correct address;
- equipment details;
- access instructions;
- job history.
A good job record should include:
- customer issue;
- service type;
- location;
- contact;
- previous history;
- known equipment;
- notes.
Better preparation increases the chance of:
first-time completion.
Step 8: Improve Parts Availability
A technician who diagnoses correctly but lacks the required part may need to:
- drive to supplier;
- leave job;
- return later.
That reduces utilization.
Track:
Which parts cause the most extra trips?
Stock common items where practical.
Use Historical Data
If technicians frequently use:
- common valves;
- breakers;
- filters;
- fittings;
consider whether those should be stocked in vans.
Do not guess.
Use actual usage data.
Step 9: Reduce Material Collection Trips
A technician spending:
90 minutes
at a supplier is expensive.
Alternatives include:
- centralized stock;
- scheduled supplier delivery;
- morning pre-pick;
- runner/delivery person;
- better van inventory.
The best method depends on scale.
Step 10: Improve Job Information
Technicians waste time calling the office because the booking says:
Boiler problem.
That is too vague.
Better:
Worcester Bosch boiler. Losing pressure every 24 hours. Customer reports no visible leak. Last service January 2026.
Now the technician can prepare.
Use Structured Booking Questions
For each service type, create questions.
Example for plumbing:
- Where is the leak?
- Is water currently running?
- Can water be isolated?
- Property type?
- Previous repair?
Better intake improves field efficiency.
Step 11: Reduce Technician Admin
Field technicians should document jobs.
But the process should not require excessive typing.
Use:
- templates;
- checklists;
- dropdowns;
- voice notes where appropriate.
Example:
Instead of typing the same completion message every time:
use a standard template with editable fields.
Do Not Remove Documentation to Save Time
Poor documentation may save:
5 minutes now
and cost:
60 minutes later
when:
- customer calls;
- another technician returns;
- invoice is disputed.
The goal is:
efficient documentation
not:
no documentation.
Step 12: Improve Dispatch Decisions
Dispatch should consider more than:
Who is free?
Also consider:
- technician location;
- skill;
- job duration;
- parts;
- urgency;
- customer history.
Assigning the wrong technician can create:
- longer travel;
- failed diagnosis;
- second visit.
Example
Customer needs commercial refrigeration repair.
Nearest technician:
10 minutes away
but lacks refrigeration experience.
Qualified technician:
25 minutes away.
The second technician may still be the better choice.
Step 13: Match Skills to Jobs
Create a technician skills matrix.
Example:
| Technician | Boiler | Heat Pump | Commercial HVAC | Electrical |
|---|---|---|---|---|
| Alex | Expert | Good | Basic | No |
| James | Good | Expert | Expert | No |
| Sarah | Basic | Good | No | Expert |
This helps dispatch assign correctly.
Step 14: Track First-Time Fix Rate
Poor first-time fix rate reduces utilization.
Technician completes job.
Then returns again.
That second visit uses capacity that could have gone to a new customer.
Track:
Eligible Jobs Fixed First Visit ÷ Eligible Jobs × 100
Improving this metric can create large capacity gains.
Step 15: Reduce Callbacks
Callbacks are another utilization loss.
If a technician spends:
5 hours per week
correcting avoidable previous work, those hours are not available for new jobs.
Use:
- quality checklists;
- proper testing;
- technician training;
- root-cause analysis.
This connects directly with Blog #81.
Step 16: Start the Day Efficiently
The first hour of the day often determines the rest.
Poor morning process:
Technician arrives
↓
looks for tools.
↓
waits for job information.
↓
loads materials.
↓
leaves late.
A better system:
vehicle prepared
first job already assigned
parts ready
route clear
The technician can leave on time.
Use Evening Preparation
Some businesses prepare:
- tomorrow’s first jobs;
- required parts;
- route;
- vehicle stock
the previous afternoon.
This reduces morning delays.
Step 17: Avoid Too Many Meetings
Meetings have a cost.
Five technicians in a one-hour meeting:
5 labor hours.
Meetings should have:
- purpose;
- agenda;
- decision.
Do not hold a 60-minute meeting when a:
10-minute briefing
would work.
Step 18: Reduce Office Interruptions
Technicians lose time calling the office for questions such as:
What’s the customer’s postcode?
How much can I charge?
Where are the job notes?
Better systems reduce interruptions.
Use:
- SOPs;
- price books;
- CRM notes;
- permissions.
The more routine decisions technicians can handle correctly, the less operational friction exists.
Step 19: Give Technicians Clear Authority
If every small decision requires owner approval, jobs slow down.
For example:
Technician may approve:
up to £75 of extra materials
without calling.
Anything above:
manager approval.
Clear authority improves speed.
Step 20: Use Standard Service Packages
Repeatable services can be standardized.
For example:
Annual Boiler Service
Standard time:
75 minutes.
Standard checklist.
Standard price.
Standard parts allowance.
This improves:
- booking;
- scheduling;
- forecasting.
Step 21: Track Jobs per Technician Carefully
Jobs per day can be useful.
But it can also create bad incentives.
Technician A:
8 small jobs.
Technician B:
3 large complex jobs.
Raw job count says Technician A is better.
That may not be true.
Use multiple metrics.
Useful Technician Metrics
Consider:
- productive hours;
- utilization;
- revenue;
- average job value;
- first-time fix rate;
- callback rate;
- customer rating.
No single number tells the whole story.
Step 22: Track Utilization by Day
You may find patterns.
Example:
Monday
75%
Tuesday
72%
Wednesday
74%
Thursday
71%
Friday
55%
Why is Friday low?
Possibilities:
- fewer bookings;
- early finishes;
- poor demand;
- route design.
Patterns help you improve staffing.
Step 23: Track Utilization by Time of Day
Maybe:
8–10 AM
strong.
2–4 PM
weak.
This may reveal:
- customers prefer morning;
- afternoon jobs run late;
- schedule gaps.
You can adapt:
- appointment availability;
- staffing;
- maintenance work.
Step 24: Track Utilization by Technician
Example:
Alex
74%
James
69%
Sarah
78%
Do not immediately blame James.
Check:
- job types;
- territory;
- vehicle;
- skill mix.
Utilization is a system metric as much as an employee metric.
Step 25: Track Utilization by Territory
If one area produces:
45 minutes average travel
while another produces:
15 minutes
your service territory may need adjustment.
Consider:
- higher travel charge;
- dedicated technician;
- tighter geographic coverage.
Step 26: Build a Capacity Dashboard
A useful weekly dashboard might include:
Available Technician Hours: 200
Productive Hours: 144
Utilization: 72%
Travel Time: 28 Hours
No-Show Time: 6 Hours
Callbacks: 8 Hours
Unfilled Gaps: 14 Hours
Now management can see where capacity disappears.
Example Before and After
Before
5 technicians.
200 available hours.
120 productive hours.
Utilization:
60%
Improvements
- better routing;
- waitlist;
- reminders;
- stocked vans;
- better dispatch.
After
144 productive hours.
Utilization:
72%
Gain:
24 hours per week.
That can equal:
3 extra technician-days of productive work.
Without another hire.
Step 27: Convert Capacity Into Revenue Carefully
Suppose recovered time is:
24 hours per week.
Average revenue per productive hour:
£120.
Potential capacity value:
£2,880/week.
This does not guarantee that revenue.
You still need:
- demand;
- profitable jobs.
But it shows why utilization matters.
Step 28: Do Not Overbook to Improve Utilization
A tempting strategy:
Schedule more jobs than we can handle.
This may increase calendar utilization.
But it can destroy:
- punctuality;
- quality;
- customer experience.
True utilization improvement comes from:
less waste
not:
more chaos.
Step 29: Protect Quality
If technicians feel pressure to rush:
- testing decreases;
- notes worsen;
- callbacks rise.
Then utilization improvement disappears because time is lost later.
Quality is part of productivity.
Step 30: Protect Technician Wellbeing
Technicians need:
- breaks;
- realistic workload;
- recovery.
High utilization should not mean:
no lunch
or:
constant overtime.
Burnout increases:
- mistakes;
- absence;
- turnover.
A healthy system balances:
efficiency + quality + sustainability.
Build a Technician Utilization SOP
Technician Utilization Review
Weekly
Review:
- available hours;
- productive hours;
- travel;
- gaps;
- no-shows;
- callbacks.
Identify
Top source of lost time.
Choose One Improvement
Example:
Travel is too high in Zone C.
Action:
- regroup routes;
- change booking windows.
Review Again
Next week.
Small continuous improvements work better than one giant overhaul.
Technician Utilization Checklist
Review your operation:
- Productive hours tracked
- Travel time measured
- Schedule gaps measured
- No-shows tracked
- Callbacks tracked
- Routes grouped geographically
- Job durations based on real data
- Common parts stocked
- Job information complete
- Technicians matched by skill
- Waitlist active
- First-time fix rate tracked
- Admin process streamlined
- Morning preparation standardized
Common Technician Utilization Mistakes
Trying to Reach 100%
Unrealistic and harmful.
Measuring Only Billable Time
Some productive tasks are necessary.
Ignoring Travel
Travel can be one of the biggest losses.
Hiring Before Fixing Scheduling
You may already have unused capacity.
Overbooking
Creates delays and complaints.
Underestimating Job Durations
Technicians fall behind.
Poor Parts Availability
Creates supplier trips.
No Waitlist
Cancellations become empty slots.
Too Much Admin
Technicians spend less time servicing customers.
Measuring Individuals Without Context
Territory and job complexity matter.
Sources and Further Reading
These official resources back up the methods in this guide and are worth reading alongside it.
- Manage your finances (U.S. Small Business Administration): bookkeeping, financial statements and cash versus accrual accounting.
- Write your business plan (U.S. Small Business Administration): building financial projections and pricing plans.
Related guides
- How to Reduce No-Shows and Last-Minute Cancellations in a Service Business
- How to Set Customer Expectations Before a Service Job: 12 Practical Steps
- How to Handle Customer Complaints in a Service Business: Step-by-Step Guide
- Tools, Software and Automation for Trades: Start Here
Frequently Asked Questions
What is technician utilization?
Technician utilization measures how much available technician time is spent on productive work.
A simple formula is:
Productive Hours ÷ Available Hours × 100
What is a good technician utilization rate?
There is no universal number.
Different service businesses have different:
- travel;
- job types;
- admin;
- territories.
Focus on improving your own trend without sacrificing quality or employee wellbeing.
Should technician utilization be 100%?
No.
Technicians need time for:
- travel;
- documentation;
- breaks;
- training.
Trying to reach 100% can increase mistakes and burnout.
How can I increase technician utilization?
Common improvements include:
- better routing;
- realistic appointment durations;
- reduced no-shows;
- fewer callbacks;
- better stock;
- less admin;
- better dispatch.
Does reducing travel improve utilization?
Yes.
Reducing unnecessary travel creates more time for productive work.
Do no-shows affect technician utilization?
Yes.
Travel and waiting for a customer who is unavailable consume paid technician time without producing customer work.
Do callbacks reduce utilization?
Yes.
Avoidable return visits consume schedule capacity that could otherwise be used for paid work.
Should I measure jobs per technician?
Yes, but do not use it alone.
Also track:
- productive hours;
- revenue;
- quality;
- first-time fix;
- callbacks.
Can better inventory improve technician productivity?
Yes.
Stocking common parts can reduce:
- supplier trips;
- unnecessary return visits.
Should I hire another technician if utilization is low?
Not automatically.
First understand why existing technicians are underutilized.
You may be able to improve capacity through better:
- scheduling;
- routing;
- demand management.
Conclusion
Learning how to improve technician utilization is one of the most powerful ways to grow a service business without immediately adding payroll.
The goal is not to make technicians:
work harder every minute.
The goal is to remove avoidable waste around them.
Look for time lost to:
Travel
↓
No-Shows
↓
Schedule Gaps
↓
Material Trips
↓
Poor Job Information
↓
Callbacks
↓
Admin
Then improve one area at a time.
A stronger operation looks like:
Better Booking
↓
Better Routing
↓
Better Preparation
↓
Right Technician
↓
First-Time Fix
↓
More Productive Hours
Suppose five technicians collectively recover:
24 productive hours per week.
That can create meaningful additional capacity without:
another van
another salary
another hire.
But do not chase utilization at the expense of:
- safety;
- quality;
- customer experience;
- employee wellbeing.
The best operation is not the one where every technician is busy every second.
It is the one where:
the right technician
is doing:
the right job
at:
the right time
with:
as little wasted capacity as possible.