
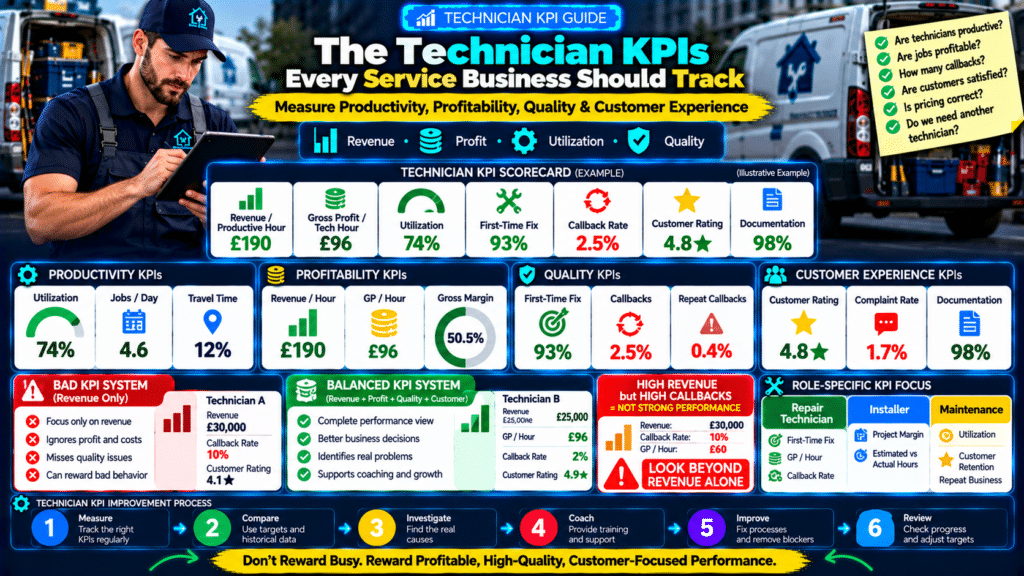
A technician can appear busy all day without necessarily producing strong business results.
Another technician may complete fewer jobs but:
- generate more gross profit;
- create fewer callbacks;
- receive better customer reviews;
- complete more work correctly on the first visit.
That is why service businesses need more than one technician performance metric.
If you only track:
jobs completed
you may reward speed while ignoring quality.
If you only track:
revenue
you may miss weak margins.
If you only track:
customer ratings
you may miss poor productivity.
A better approach is to use a balanced set of technician KPIs for service businesses.
A useful technician scorecard might include:
Utilization
↓
Revenue
↓
Gross Profit
↓
First-Time Fix
↓
Callbacks
↓
Customer Experience
↓
Documentation
The goal is not to create a surveillance system.
The goal is to understand:
- where technicians are performing well;
- where the business system is creating problems;
- where training or operational improvements are needed.
What Is a Technician KPI?
KPI stands for:
Key Performance Indicator.
A technician KPI measures an important part of field performance.
For example:
- how much technician time is productive;
- how much revenue is produced;
- how much gross profit remains;
- how often work needs to be repeated;
- how satisfied customers are.
A good KPI should help management make a decision.
If a metric does not change what you do:
it may not be worth tracking.
Why Technician KPIs Matter
Technicians affect almost every important part of a service business.
They influence:
- revenue;
- labor cost;
- customer satisfaction;
- reviews;
- referrals;
- callbacks;
- repeat customers.
They also represent the company inside customers’ homes and businesses.
That makes field performance both:
financial
and:
customer-facing.
Do Not Manage Technicians Using One Number
Imagine two technicians.
Technician A
Revenue:
£30,000
Callback rate:
10%
Customer rating:
4.1★
Technician B
Revenue:
£25,000
Callback rate:
2%
Customer rating:
4.9★
If you only track revenue:
Technician A looks better.
If you include quality:
the picture changes.
This is why balanced technician KPIs matter.
KPI 1: Technician Utilization Rate
Technician utilization measures how much available technician time is spent on productive work.
Formula:
Productive Hours ÷ Available Hours × 100
Example:
Available hours:
160
Productive hours:
120
Utilization:
75%
Why Utilization Matters
Low utilization may indicate:
- schedule gaps;
- weak demand;
- too much travel;
- no-shows;
- poor dispatch.
High utilization can indicate efficient operations.
But too high can also mean:
- overloaded schedules;
- rushed jobs;
- burnout.
The goal is:
healthy utilization
not:
100% utilization.
Utilization Example
Technician A
Available:
160 hours.
Productive:
Utilization:
75%
Technician B
Available:
Productive:
Utilization:
55%
Before assuming Technician B is underperforming, investigate:
- territory;
- dispatch;
- job availability.
Utilization is often a system metric as much as an employee metric.
KPI 2: Revenue per Technician
Formula:
Field Revenue ÷ Number of Technicians
Example:
Monthly field revenue:
£120,000
Technicians:
6
Revenue per technician:
£20,000
This helps you understand whether field capacity is producing enough sales.
Why Revenue per Technician Matters
Every technician may require:
- wages;
- van;
- fuel;
- tools;
- software;
- insurance.
Revenue per technician helps you compare field output against the cost of supporting that technician.
But do not use it alone.
Revenue does not tell you whether the work was profitable.
KPI 3: Revenue per Productive Hour
Formula:
Technician Revenue ÷ Productive Technician Hours
Example:
Technician revenue:
£24,000
Productive hours:
120
Revenue per productive hour:
£200
This helps you understand the value of technician time.
Why It Matters
Two technicians may both produce:
£24,000
but one may use:
100 hours
while the other uses:
140.
Revenue per hour adds useful context.
KPI 4: Gross Profit per Technician
This is stronger than revenue alone.
Formula:
Technician Revenue − Direct Job Costs = Gross Profit
Example:
Revenue:
£25,000
Direct costs:
£15,000
Gross profit:
£10,000
Now you know how much value the technician’s jobs contributed before company overhead.
Why Gross Profit Matters
A technician producing:
£30K revenue
at:
20% margin
creates:
£6K gross profit.
A technician producing:
£24K revenue
at:
45% margin
creates:
£10.8K gross profit.
Higher revenue does not always mean better economics.
KPI 5: Gross Profit per Technician Hour
Formula:
Gross Profit ÷ Productive Technician Hours
Example:
Gross profit:
£10,000
Productive hours:
120
Gross profit per hour:
£83.33
This is one of the strongest technician profitability metrics.
What It Tells You
It helps answer:
- Which technicians are producing profitable work?
- Which services consume too much field time?
- Is pricing high enough?
- Is service mix appropriate?
Use it carefully.
Job assignment can strongly affect the result.
KPI 6: Gross Profit per Available Hour
Productive-hour metrics measure job performance.
Available-hour metrics also capture:
- downtime;
- travel;
- schedule gaps.
Formula:
Gross Profit ÷ Available Hours
Example:
Gross profit:
£10,000
Available hours:
160
Gross profit per available hour:
£62.50
If productive-hour profitability is strong but available-hour profitability is weak:
your problem may be scheduling rather than technician skill.
KPI 7: First-Time Fix Rate
First-time fix rate measures how often eligible jobs are resolved without another visit.
Formula:
Jobs Fixed on First Visit ÷ Eligible Jobs × 100
Example:
200 eligible jobs.
184 resolved first visit.
First-time fix rate:
92%.
Why First-Time Fix Matters
Higher first-time fix rates can improve:
- customer satisfaction;
- technician capacity;
- profitability.
Second visits consume:
- labor;
- travel;
- scheduling capacity.
But do not chase 100% at any cost.
Some jobs genuinely require:
- specialist parts;
- follow-up visits.
KPI 8: Callback Rate
Formula:
Callbacks ÷ Completed Jobs × 100
Example:
400 jobs.
16 callbacks.
Callback rate:
4%.
Track callback reasons such as:
- workmanship;
- misdiagnosis;
- failed part;
- incomplete work;
- customer misunderstanding.
Why Callback Rate Matters
Callbacks create cost without equivalent new revenue.
They can also damage:
- customer trust;
- reviews.
A rising callback rate deserves investigation.
KPI 9: Repeat Callback Rate
A second callback on the same job is especially serious.
Track:
jobs requiring more than one unplanned return visit.
Example:
Initial visit
↓
Callback 1
↓
Callback 2
Repeated callbacks may indicate:
- poor diagnosis;
- inadequate escalation;
- training gaps.
These cases should often receive management review.
KPI 10: Average Job Value
Formula:
Technician Revenue ÷ Jobs Completed
Example:
Revenue:
£22,000
Jobs completed:
55
Average job value:
£400
This helps explain changes in technician revenue.
Example
Revenue per technician falls.
Why?
Maybe:
- technician completed fewer jobs;
or:
- average job value dropped.
Those require different solutions.
KPI 11: Jobs Completed per Day
This can be useful within the same service type.
Example:
Repair technician:
5 jobs/day
But use caution.
An installation technician may only complete:
one job over several days.
Do not compare completely different roles using raw job count.
KPI 12: Average Job Duration
Track:
scheduled duration
vs:
actual duration.
Example:
Boiler service scheduled:
60 minutes
Actual average:
82 minutes
That tells you the scheduling standard may be wrong.
Why Job Duration Matters
Underestimated jobs create:
- late technicians;
- overtime;
- customer frustration.
Historical duration data improves future planning.
KPI 13: Travel Time per Technician
Track:
total travel hours
or:
average travel time between jobs.
Example:
Technician A:
6 travel hours/week
Technician B:
12 hours/week
This may reveal:
- routing problems;
- oversized service territory.
Travel is paid time that usually produces no direct customer revenue.
KPI 14: Schedule Gap Time
Track unused time between:
- jobs.
For example:
Technician has:
4.5 unassigned hours/week.
Across:
8 technicians
that becomes:
36 hours of unused weekly capacity.
Better scheduling can recover some of that time.
KPI 15: No-Show Time Lost
Track:
- technician hours lost due to no-shows;
- access failures.
Example:
No-shows cause:
18 technician hours/month
of lost capacity.
This makes the operational cost visible.
KPI 16: Overtime Hours
Overtime can indicate:
- high demand;
- poor scheduling;
- insufficient staffing.
Track:
overtime per technician
and:
overtime cost.
If overtime remains consistently high:
you may need another technician.
If overtime is high while utilization is low:
your scheduling process may be broken.
KPI 17: Customer Rating
Track customer satisfaction after technician visits.
Possible measures:
- review score;
- CSAT survey;
- internal rating.
Example:
4.8 / 5
Customer feedback helps capture behavior that financial metrics cannot.
Do Not Use Rating Alone
Some technicians handle:
- difficult jobs;
- unhappy customers.
Use enough data before drawing conclusions.
KPI 18: Customer Satisfaction Score
A simple post-job question:
How satisfied were you with today’s service?
Could use:
1–5 rating.
Track:
- average;
- trend;
- comments.
Qualitative comments are often more useful than the number alone.
KPI 19: Complaint Rate
Track complaints connected to each technician.
But also classify:
- technician-related;
- scheduling-related;
- pricing-related.
Do not blame the technician for issues caused by the office.
Example
Customer complains:
Technician arrived late.
Was technician responsible?
Maybe.
Or previous appointment was incorrectly scheduled.
Root cause matters.
KPI 20: Documentation Completion Rate
Technicians may need to submit:
- notes;
- photos;
- materials used;
- customer approvals.
Formula:
Jobs With Complete Documentation ÷ Jobs Completed × 100
Example:
100 jobs.
96 complete.
Documentation completion rate:
96%.
Why Documentation Matters
Good documentation supports:
- invoicing;
- callbacks;
- warranty;
- customer service;
- future visits.
Missing documentation creates hidden administrative cost.
KPI 21: Photo Compliance
If certain jobs require:
- before photos;
- after photos;
track whether those were uploaded.
Example:
Installations requiring four photos:
98% compliant.
This is simple but useful quality control.
KPI 22: Estimate Accuracy
If technicians create estimates:
compare:
Estimated Labor
with:
Actual Labor.
Example:
Estimated:
5 hours.
Actual:
Variance:
+60%.
Large repeated variance indicates:
- estimating issues;
- job complexity;
- training needs.
KPI 23: Estimated Margin vs Actual Margin
Example:
Quoted margin:
40%
Actual:
29%
Difference:
−11 percentage points.
Track why.
Possible causes:
- labor overrun;
- material variance;
- discounts;
- callbacks.
This improves future pricing.
KPI 24: Discount Rate
Formula:
Discounts Given ÷ Pre-Discount Revenue × 100
Example:
Potential revenue:
£20,000
Discounts:
£1,000
Discount rate:
5%.
Repeated high discounting may damage margins.
KPI 25: Change Order Capture Rate
For larger jobs, additional work should be documented and charged where appropriate.
Track:
approved change orders
rather than allowing technicians to perform free extras.
This protects:
- scope;
- margin.
KPI 26: Material Variance
Compare:
estimated material cost
with:
actual cost.
Example:
Estimated:
£500.
Actual:
£680.
Variance:
+£180
Track repeated differences.
This can reveal:
- estimating issues;
- material waste;
- supplier increases.
KPI 27: Parts Availability / Supplier Trip Rate
Track:
jobs requiring technicians to leave for parts.
Example:
20% of repair jobs require supplier trip.
That may indicate:
- poor van stock;
- weak preparation.
Reducing supplier trips can improve technician utilization.
KPI 28: Warranty Cost
Track:
- free labor;
- replacement materials
associated with warranty work.
Technician revenue can look strong until repeated warranty cost is considered.
Link warranty cost back to original jobs.
KPI 29: Repeat Customer Rate
Technicians affect retention too.
Track whether customers:
- rebook;
- request the same technician.
A technician who creates long-term customers adds value beyond the original invoice.
KPI 30: Review Generation
You may track:
completed jobs that result in customer reviews.
But be careful.
Do not create incentives that pressure customers or encourage review gating.
Focus on:
good service + consistent review request process.
Build a Balanced Technician Scorecard
You do not need 30 KPIs on every weekly dashboard.
Choose the metrics most relevant to your operation.
A balanced technician scorecard might contain:
Financial
- Revenue per productive hour
- Gross profit per tech hour
Productivity
- Utilization
- Jobs completed
Quality
- First-time fix
- Callback rate
Customer
- Customer rating
Process
- Documentation completion
That is enough for many businesses.
Example Technician Scorecard
Revenue / Productive Hour: £190
Gross Profit / Tech Hour: £96
Utilization: 74%
First-Time Fix Rate: 93%
Callback Rate: 2.5%
Customer Rating: 4.8★
Documentation: 98%
Now management gets a much more balanced picture.
Use Targets Carefully
Do not choose arbitrary numbers.
Targets should reflect:
- current performance;
- financial needs;
- job type.
For example:
a plumbing repair technician and an electrical installation technician should not necessarily have identical targets.
Green, Yellow, Red KPI Bands
A simple dashboard can use:
Green
At or above target.
Yellow
Needs attention.
Red
Requires investigation.
Example:
Callback Rate
Green:
<3%
Yellow:
3–5%
Red:
5%
Those numbers are illustrative.
Use thresholds appropriate to your own business.
Do Not Turn KPIs Into Punishment
If technicians believe KPIs exist only to:
find mistakes
they may:
- hide problems;
- manipulate data.
The better approach:
Here is the issue. What is causing it, and what can we improve?
KPIs should support:
- coaching;
- process improvement.
Separate Employee Problems From System Problems
Suppose utilization is low.
Possible causes:
Technician Problem
Repeatedly starting late.
System Problem
Not enough jobs booked.
Those require completely different responses.
Never assume the employee is the cause just because their metric is weak.
Use Root-Cause Analysis
When a KPI is off target:
ask:
Why?
Example:
Callback rate rising.
Why?
↓
Misdiagnosis.
Why?
↓
Technicians unfamiliar with new equipment.
Action:
training.
Without root-cause analysis, dashboards become decoration.
Track Trends, Not Just Rankings
A technician may improve from:
70% utilization
to:
76%.
Even if another technician is at:
80%,
the improvement matters.
Track:
- current level;
- previous level;
- trend.
Avoid Public Leaderboards for Everything
Leaderboards may work for some sales metrics.
But publicly ranking:
- complaints;
- callbacks;
- customer scores
can create unhealthy team dynamics.
Use discretion.
Compare Like With Like
Do not compare:
maintenance technician
directly with:
commercial installer
without adjustment.
Segment by:
- role;
- service type;
- territory.
Fair comparisons increase trust in the KPI system.
Create Role-Based Scorecards
Repair Technician
Focus on:
- first-time fix;
- GP/hour;
- callback rate;
- utilization.
Installer
Focus on:
- project margin;
- estimated vs actual hours;
- documentation;
- quality.
Maintenance Technician
Focus on:
- utilization;
- customer retention;
- checklist completion.
Different roles need different metrics.
Technician KPIs and Compensation
Some businesses connect bonuses to performance.
Be careful.
Revenue-only bonuses can encourage:
- overselling.
Speed-only bonuses can encourage:
- rushed work.
A balanced incentive might consider:
profitability + quality + customer experience.
Any compensation design should also comply with employment and wage laws applicable to your jurisdiction.
Example Balanced Bonus Structure
Illustrative only:
30% — Team Gross Profit
25% — First-Time Fix
20% — Customer Satisfaction
15% — Documentation
10% — Safety / Process Compliance
This reduces pressure on one metric.
Team KPIs vs Individual KPIs
Some problems should be measured at:
team level.
Examples:
- branch utilization;
- gross margin;
- complaint rate.
This encourages teamwork.
If only individual performance matters:
technicians may compete instead of helping each other.
Track Safety Separately
Safety should not be treated as a productivity trade-off.
Do not reward technicians for:
working faster
if it encourages them to ignore safety procedures.
Safety compliance should remain non-negotiable.
Technical and safety standards must follow applicable:
- regulations;
- licensing;
- qualified procedures.
Weekly Technician KPI Review
A weekly operational review can include:
- utilization;
- jobs;
- revenue;
- callbacks;
- first-time fix.
Keep it short.
Focus on unusual changes.
Monthly Technician KPI Review
Monthly:
add:
- gross profit;
- margin;
- customer satisfaction;
- documentation;
- training needs.
This provides a broader picture.
Quarterly Performance Review
Quarterly discussions can include:
- KPI trends;
- strengths;
- training goals;
- career development.
The conversation should not be:
Here are your numbers.
It should be:
Here is what the numbers show. What do we improve next?
Build a Technician Dashboard
Example:
Revenue / Hour: £190
GP / Hour: £96
Utilization: 74%
First-Time Fix: 93%
Callbacks: 2.5%
Customer Rating: 4.8★
Documentation: 98%
Use:
- trends;
- targets.
Avoid overly complicated dashboards.
Company-Level Field Dashboard
Management may also track:
Total Available Hours: 1,200
Productive Hours: 864
Utilization: 72%
Revenue: £180K
Gross Profit: £76K
Callbacks: 3.1%
First-Time Fix: 92%
This helps evaluate the whole operating system.
KPI Example: What Looks Good but Is Actually Bad?
Suppose:
Revenue per technician increases:
15%.
Great?
Maybe.
But:
Callback rate doubles.
Overtime rises.
Customer rating falls.
That may be unhealthy growth.
A balanced scorecard reveals the trade-off.
KPI Example: Lower Revenue but Better Business
Technician revenue drops:
5%.
But:
- gross profit/hour rises;
- callbacks fall;
- customer satisfaction improves.
That may actually be an improvement.
This is why the system matters more than one number.
Use KPIs Before Hiring
If:
- utilization is high;
- GP/hour healthy;
- first-time fix healthy;
- schedules full;
another technician may make sense.
If:
- utilization low;
- revenue per hour weak;
hiring may make the problem worse.
Use KPIs for Training
Example:
Technician has:
Strong customer ratings.
Strong utilization.
Weak first-time fix.
Action:
diagnostic training.
Another technician:
Strong quality.
Low utilization.
Action may be:
dispatch/scheduling review
rather than employee training.
Use KPIs to Improve SOPs
If all technicians struggle with:
documentation compliance
maybe the SOP or software is too complicated.
If all technicians have:
high supplier trip rates
maybe van stock policy is weak.
KPIs reveal system problems.
Common Technician KPI Mistakes
Tracking Too Many Metrics
Nobody knows what matters.
Tracking Only Revenue
Margin and quality disappear.
Using Job Count Alone
Job complexity varies.
Comparing Different Roles
Unfair.
Ignoring Territory
Travel affects results.
Punishing People Without Investigation
Kills trust.
Chasing 100% Utilization
Creates burnout.
Ignoring Customer Experience
Short-term productivity can damage long-term value.
Poor Data
Wrong inputs create wrong conclusions.
Never Changing Targets
Business conditions change.
Start With 7 KPIs
If you are starting from zero, use:
- Technician Utilization
- Revenue per Productive Hour
- Gross Profit per Tech Hour
- First-Time Fix Rate
- Callback Rate
- Customer Rating
- Documentation Completion
That is enough to build a strong first dashboard.
Technician KPI Checklist
Confirm:
- KPI definitions documented
- Available hours tracked
- Productive hours tracked
- Revenue linked to jobs
- Direct costs captured
- Gross profit calculated
- First-time fix tracked
- Callbacks categorized
- Customer feedback captured
- Documentation measured
- Roles compared fairly
- Targets reviewed
- KPIs used for coaching
- Root causes investigated
- Safety never compromised
Sources and Further Reading
These official resources back up the methods in this guide and are worth reading alongside it.
- Manage your finances (U.S. Small Business Administration): bookkeeping, financial statements and cash flow basics.
- Write your business plan (U.S. Small Business Administration): building financial projections.
Related guides
- How to Set Customer Expectations Before a Service Job: 12 Practical Steps
- Tools, Software and Automation for Trades: Start Here
Frequently Asked Questions
What are the most important technician KPIs?
A strong starter set includes:
- utilization;
- revenue per hour;
- gross profit per hour;
- first-time fix;
- callback rate;
- customer satisfaction.
What is technician utilization?
It measures:
Productive Hours ÷ Available Hours × 100
What is first-time fix rate?
It measures the percentage of eligible jobs resolved without requiring another visit.
Should revenue be used as a technician KPI?
Yes, but never alone.
Pair it with:
- gross profit;
- quality;
- customer metrics.
Is jobs per day a good KPI?
Sometimes.
It is most useful when comparing similar job types.
How should technician quality be measured?
Consider:
- first-time fix;
- callback rate;
- customer feedback;
- documentation.
What is a good callback rate?
There is no universal number across every trade.
Compare your own historical performance and job complexity.
Should technicians see their KPIs?
Usually transparency helps, provided:
- definitions are clear;
- metrics are fair.
Should bonuses be tied to KPIs?
They can be, but avoid single-metric incentives that encourage unhealthy behavior.
How often should KPIs be reviewed?
Weekly for operational metrics and monthly for deeper financial performance works well for many service businesses.
Conclusion
The best technician KPIs for service businesses do not answer only:
“Who completed the most jobs?”
They answer:
Are we using technician time well?
Are the jobs profitable?
Are they completed correctly?
Are customers satisfied?
A balanced technician dashboard should combine:
Productivity
Profitability
Quality
Customer Experience
A practical starting point is:
Utilization
↓
Revenue per Productive Hour
↓
Gross Profit per Tech Hour
↓
First-Time Fix
↓
Callback Rate
↓
Customer Rating
↓
Documentation
Then use those metrics to improve:
- scheduling;
- pricing;
- training;
- SOPs;
- hiring.
KPIs should not become a system for making technicians feel constantly watched.
They should answer:
Where is the business working well, and where can we improve?
A technician who is:
profitable
but produces poor-quality work is not a strong performer.
A technician who creates:
excellent quality
but has large amounts of idle time may be working inside a weak scheduling system.
The goal is balance.
The strongest service businesses do not simply measure:
how busy technicians are.
They measure:
how productively, profitably, and professionally technician capacity is being used.