
Many service-business owners assume there is only one way to improve profit margins:
charge more.
Sometimes higher prices are necessary.
But gross margin can also improve by changing:
- how jobs are estimated;
- how technicians use time;
- how materials are purchased;
- how callbacks are controlled;
- how discounts are approved;
- which services are promoted.
That matters because gross margin is not only a pricing number.
It is the result of:
Selling Price
minus:
Direct Job Costs
A simple formula is:
Gross Profit = Revenue − Direct Costs
Then:
Gross Margin = Gross Profit ÷ Revenue × 100
If a £1,000 job costs £600 to deliver:
Gross profit:
£400
Gross margin:
40%
If the same job can be delivered for:
£550
without reducing quality:
Gross profit becomes:
£450
Gross margin:
45%
You improved margin without increasing the customer’s price.
That is why learning how to improve gross margin in a service business should focus on the entire job economics—not only price increases.
Why Gross Margin Matters
Gross margin tells you how much revenue remains after direct job costs.
That money has to cover:
- office salaries;
- rent;
- vehicles;
- software;
- insurance;
- marketing;
- management;
- profit.
A company with weak gross margins may have:
- lots of revenue;
- full calendars;
- little profit.
That is why margin deserves regular attention.
Example
Business A
Revenue:
£100,000
Gross margin:
25%
Gross profit:
£25,000
Business B
Revenue:
£80,000
Gross margin:
45%
Gross profit:
£36,000
Business B produces less revenue but more gross profit.
This is why:
revenue growth without margin discipline can be misleading.
Step 1: Measure Gross Margin by Service
Do not only track company average.
Break it down.
For example:
| Service | Revenue | Gross Margin |
|---|---|---|
| Emergency Repairs | £25K | 55% |
| Maintenance | £20K | 52% |
| Installations | £60K | 27% |
| Commercial Work | £40K | 30% |
Now you can see which services are:
- profitable;
- weak;
- worth reviewing.
Without service-level data, everything gets blended together.
Step 2: Find Your Lowest-Margin Jobs
Review jobs with unexpectedly weak results.
For example:
Job #1048
Quoted margin:
40%
Actual margin:
24%
Why?
Possible reasons:
- labor ran over;
- materials cost more;
- scope changed;
- discount applied;
- callback occurred.
Do not simply label the job:
bad.
Find the cause.
Step 3: Improve Labor Efficiency
Labor is one of the biggest direct costs in many service businesses.
Suppose:
A job is quoted for:
4 hours
but actually takes:
7 hours.
Loaded technician cost:
£30/hour
Extra labor cost:
£90
That directly reduces gross profit.
Improve Labor Efficiency Without Rushing
The goal is not:
work faster at any cost.
The goal is:
remove wasted time.
Examples:
- better job preparation;
- correct technician assignment;
- proper parts on van;
- clear job notes;
- realistic scheduling.
Efficiency should reduce waste, not quality.
Step 4: Improve Estimates
Bad estimating destroys margin before the job starts.
Common problems:
- underestimating labor;
- missing materials;
- forgetting disposal;
- ignoring subcontractor cost.
Use historical job data.
If the last 20 jobs averaged:
6.5 technician hours
stop estimating:
4 hours.
Step 5: Improve Parts and Material Purchasing
Material costs can often be improved through:
- better supplier negotiation;
- bulk purchasing;
- standard product ranges;
- price monitoring.
But do not buy excessive inventory just to get discounts.
Unused stock traps cash.
Example
Material cost per job:
Before:
£400
After supplier negotiation:
£360
Saving:
£40/job
Across 100 jobs:
£4,000
Small cost reductions scale quickly.
Step 6: Reduce Material Waste
Waste can come from:
- over-ordering;
- damaged stock;
- lost items;
- poor van organization.
Track:
Estimated Materials
vs.
Actual Materials
Large variance may reveal problems.
Step 7: Reduce Supplier Trips
A technician driving to a supplier during the day creates:
- labor cost;
- fuel cost;
- lost job capacity.
Better van stock can improve margin.
Track which parts cause repeated trips.
Then stock the most common ones.
Step 8: Reduce Callbacks
Callbacks are margin killers.
They create additional:
- labor;
- fuel;
- material cost
without additional revenue.
Suppose a job originally generates:
£400 gross profit.
Callback costs:
£120
Adjusted contribution becomes:
£280
That is a major reduction.
Improve:
- diagnosis;
- testing;
- job completion checklists;
- technician training.
Step 9: Improve First-Time Fix Rate
The more jobs resolved on the first visit, the better your capacity and job economics tend to be.
Second visits often create extra:
- travel;
- labor;
- customer frustration.
Track:
First-Time Fix Rate
by technician and service type.
Use the data for coaching.
Step 10: Control Discounts
Discounts reduce gross profit faster than many owners realize.
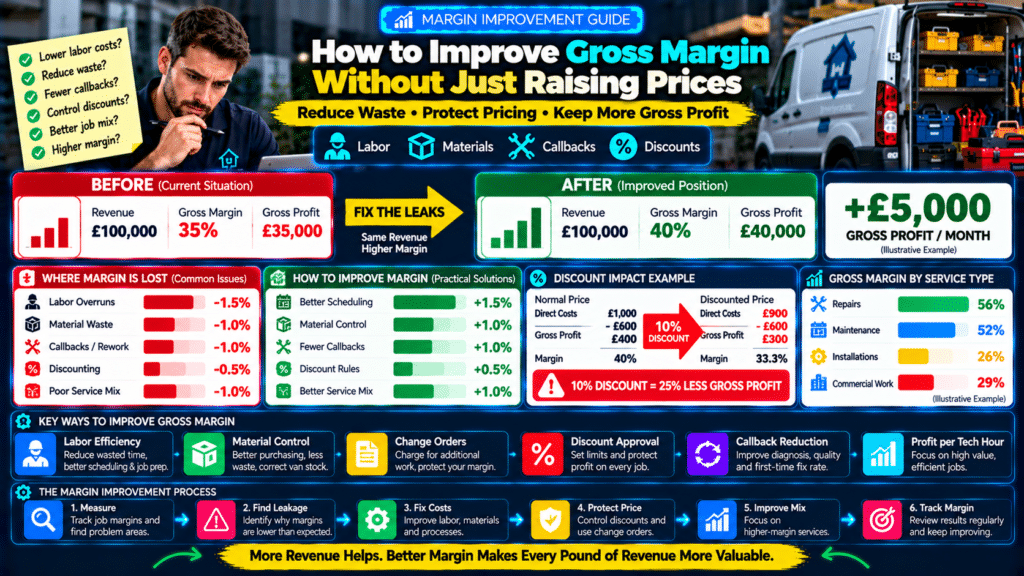
Example:
Normal price:
£1,000
Direct costs:
£600
Gross profit:
£400
Margin:
40%
Now discount 10%.
New price:
£900
Costs still:
£600
Gross profit:
£300
Margin:
33.3%
A 10% price discount reduced gross profit by:
25%.
This is why discount policies matter.
Step 11: Create Discount Approval Limits
For example:
Technician:
Up to 3%
Manager:
Up to 7%
Anything above:
Director approval
The actual limits depend on your business.
The purpose is to protect margin.
Step 12: Stop Giving Away Extra Work
This happens constantly.
Customer asks:
While you’re here, can you also look at this?
Technician says:
Sure.
Extra:
- 30 minutes;
- materials.
No charge.
That quietly reduces margin.
Use:
scope control
and:
change orders.
Step 13: Standardize Change Orders
For larger jobs:
Additional Work Identified
↓
Price Calculated
↓
Customer Approves
↓
Work Completed
Do not rely on:
We’ll sort it out later.
Get approval first.
Step 14: Improve Price Books
A price book should reflect:
- actual labor;
- current material costs;
- target margin.
Review it regularly.
A price book built two years ago may no longer be profitable.
Step 15: Remove Old Pricing
Costs change.
If technician wages rise 10% but your pricing remains unchanged:
margin drops.
Same with:
- fuel;
- insurance;
- parts.
Pricing should be reviewed periodically.
Step 16: Improve Service Mix
You do not need to sell every service equally.
Suppose:
Service A
Average margin:
55%
Service B
Average margin:
22%
If demand exists for Service A:
you may want to market it more aggressively.
This can improve overall company gross margin.
Step 17: Compare Gross Profit Per Technician Hour
This is one of the most useful service metrics.
Formula:
Gross Profit ÷ Technician Hours
Example:
Job A
Gross profit:
£600
Hours:
3
Gross profit per tech hour:
£200
Job B
Gross profit:
£1,000
Hours:
10
Gross profit per tech hour:
£100
Job B produces more total gross profit.
Job A uses technician capacity more efficiently.
Both metrics matter.
Step 18: Reduce Travel Time
Travel is often a hidden labor cost.
Better routing can:
- increase productive hours;
- reduce fuel;
- improve daily capacity.
Group jobs geographically.
Use:
- zones;
- route planning;
- better dispatch.
Step 19: Improve Scheduling
Bad schedules create:
- gaps;
- overtime;
- rushed work.
All of these can reduce margin.
Use realistic job durations.
Do not schedule:
90-minute jobs
into:
60-minute slots.
Step 20: Reduce Overtime
Overtime may increase labor cost.
If a job is routinely completed after hours:
the true labor cost may be higher than expected.
Track:
overtime by job.
If one service regularly causes overtime:
reprice it or reschedule it.
Step 21: Improve Technician Matching
Wrong technician:
- takes longer;
- makes mistakes;
- requires help.
Right technician:
- diagnoses faster;
- completes more confidently.
Skill-based dispatch can improve margins.
Step 22: Train Technicians on Commercial Awareness
Technicians do not need to become accountants.
But they should understand that:
- time has cost;
- materials have cost;
- unnecessary rework matters.
This encourages better operational decisions.
Step 23: Reduce Unbilled Materials
Technicians may use extra parts without updating the invoice.
That creates silent margin loss.
Track:
materials used
against:
materials billed.
If extra customer-approved work is performed:
bill it.
Step 24: Reduce Payment Processing Cost Where Practical
Payment processing fees may not always be classified as direct costs, depending on your accounting method.
But they still affect overall profitability.
Review:
- merchant fees;
- payment methods.
Do not compromise customer convenience unnecessarily.
Just understand the cost.
Step 25: Reduce Subcontractor Cost Leakage
For subcontracted work:
- agree rates;
- define scope;
- approve extras.
Otherwise subcontractor costs can expand after the quote is already fixed.
Step 26: Compare Quoted vs Actual Margin
Every month, review:
Quoted Margin
vs.
Actual Margin
Example:
Quoted:
42%
Actual:
34%
Difference:
−8 points
Find the cause.
This is one of the most useful profitability reports.
Step 27: Create Margin Variance Categories
For low-margin jobs, tag the reason.
Examples:
- labor overrun;
- material price increase;
- uncharged extra work;
- discount;
- callback;
- estimate error.
Then review trends.
Example
This month:
18 low-margin jobs
Causes:
Labor overruns: 8
Material variance: 4
Discounting: 3
Callbacks: 2
Other: 1
Now you know where to focus.
Step 28: Set Margin Targets by Service
Do not use one target for everything.
Example:
Maintenance
Target:
50%+
Repair
Target:
45%+
Installation
Target:
30%+
These are illustrative only.
Your actual targets depend on:
- overhead;
- competition;
- service type.
Step 29: Use Green, Yellow, Red Margin Bands
Example:
Green
At or above target.
Yellow
Within 5 points below target.
Red
More than 5 points below target.
This makes reporting easier.
Step 30: Improve Gross Margin Through Better Sales
Sales quality affects margin too.
If sales staff always sell the cheapest option:
margin may suffer.
Give customers clear:
- good;
- better;
- best
choices where appropriate.
This can increase average job value and margin.
Step 31: Avoid Competing Only on Price
If your strategy is:
always be cheapest
you may struggle to maintain margin.
Customers also value:
- reliability;
- speed;
- warranty;
- professionalism;
- convenience.
Better positioning can support stronger pricing.
Step 32: Improve Customer Experience
This may seem unrelated to margin.
But better service can reduce:
- refunds;
- credits;
- complaints.
Those directly protect profitability.
Step 33: Track Refund and Credit Costs
If you issue:
£3,000/month
in refunds and credits:
that is margin loss.
Track:
- reason;
- technician;
- service type.
Then fix patterns.
Step 34: Track Warranty Costs
Warranty work uses resources.
Track it by:
- service;
- part;
- technician.
This helps identify repeated quality issues.
Step 35: Improve Supplier Terms
Better terms can improve cash flow and sometimes pricing.
Examples:
- volume discounts;
- rebates;
- longer payment terms.
Do not choose a supplier only because they are cheapest.
Quality matters too.
Cheap parts that fail can create expensive callbacks.
Step 36: Stop Buying the Wrong Work
Some jobs are just poor fits.
Examples:
- too far away;
- unusual equipment;
- low-value one-off jobs.
If these repeatedly create weak margins:
consider declining them or pricing them higher.
Step 37: Use Minimum Service Charges
Small jobs can consume disproportionate travel and admin time.
A minimum charge helps protect margin.
Example:
Technician spends:
- 20 minutes on repair;
- 45 minutes travel;
- 15 minutes admin.
Without minimum pricing, margin may be poor.
Step 38: Use Travel Zones
For distant jobs:
- add travel charge;
- increase minimum service value.
Distance has a cost.
Do not pretend it is free.
Step 39: Reduce Administrative Leakage
Office errors can also reduce margin.
Examples:
- missing invoices;
- missed change orders;
- incorrect discounts.
Good processes matter.
Step 40: Review Job Profitability Weekly
Do not wait until year-end.
A weekly review can identify:
- bad estimates;
- price-book problems;
- technician trends.
Small corrections happen sooner.
Gross Margin Improvement Example
Suppose monthly revenue is:
£100,000
Current gross margin:
35%
Gross profit:
£35,000
Through:
- better labor efficiency;
- material control;
- fewer callbacks;
margin improves to:
40%
Gross profit becomes:
£40,000
Gain:
£5,000/month
without increasing revenue.
That is:
£60,000/year
in additional gross profit before considering other changes.
Example Improvement Breakdown
Starting gross margin:
35%
Then:
Labor efficiency:
+1.5 points
Material purchasing:
+1 point
Callback reduction:
+1 point
Discount control:
+0.5 point
Better service mix:
+1 point
New margin:
40%
These are illustrative figures.
The point is that several small improvements can compound.
Gross Margin vs Net Margin
Remember:
Gross margin is not net profit margin.
Gross margin covers:
- overhead;
- profit.
You can improve gross margin and still have weak net profit if:
- overhead is too high.
Both need attention.
Gross Margin and Break-Even Revenue
Higher gross margin reduces required break-even revenue.
Example:
Fixed overhead:
£20,000
At 35% Margin
Break-even:
£57,143
At 40% Margin
Break-even:
£50,000
Improving margin by five percentage points reduces break-even revenue by:
more than £7,000/month.
That is powerful.
Gross Margin and Cash Flow
Higher margin can improve cash generation.
But only if customers actually pay.
This is why gross margin should be monitored alongside:
- receivables;
- cash flow.
Gross Margin Dashboard
Track:
Company Gross Margin
Margin by Service
Quoted vs Actual Margin
Low-Margin Jobs
Gross Profit per Tech Hour
Discount Cost
Callback Cost
Material Variance
This gives a full picture.
Gross Margin Improvement Checklist
Review:
- Margin tracked by service
- Low-margin jobs reviewed
- Actual labor tracked
- Material variance tracked
- Supplier pricing reviewed
- Van stock optimized
- Callbacks tracked
- First-time fix monitored
- Discounts controlled
- Change orders used
- Price book updated
- Service mix reviewed
- Gross profit per tech hour tracked
- Travel cost considered
- Warranty/refund costs tracked
Sources and Further Reading
These official resources back up the methods in this guide and are worth reading alongside it.
- Write your business plan (U.S. Small Business Administration): building financial projections and pricing plans.
- Manage your finances (U.S. Small Business Administration): bookkeeping, financial statements and cash versus accrual accounting.
- What kind of records should I keep (IRS): the income and expense records your job costing should be built on.
Related guides
- How to Calculate Gross Profit Per Job in a Service Business
- How to Price Service Jobs Without Guessing: Labor, Materials, Overhead & Profit
- Revenue vs Profit vs Cash Flow: What Service Business Owners Need to Know
- Tools, Software and Automation for Trades: Start Here
Frequently Asked Questions
How do I improve gross margin in a service business?
Focus on:
- accurate pricing;
- better labor efficiency;
- material control;
- fewer callbacks;
- discount discipline;
- better service mix.
Do I need to raise prices to improve margin?
Not always.
You can also reduce direct costs and waste.
What is gross margin?
Gross margin is:
Gross Profit ÷ Revenue × 100
It shows how much revenue remains after direct costs.
What causes gross margin to fall?
Common causes include:
- labor overruns;
- material inflation;
- excessive discounts;
- callbacks;
- poor estimating.
Should every service have the same margin target?
No.
Different services may reasonably have different targets.
How often should gross margin be reviewed?
Monthly is useful for company-level performance, while job-level exceptions can be reviewed weekly.
Can lower travel improve margin?
Yes.
Less travel can reduce labor and vehicle cost per job.
Do callbacks reduce margin?
Yes.
They create extra direct cost without new revenue.
Can discounts hurt margin significantly?
Yes.
A small price discount can create a much larger percentage reduction in gross profit.
Should I track gross profit per technician hour?
Yes.
It helps show which jobs use field capacity most efficiently.
Conclusion
Learning how to improve gross margin in a service business does not mean simply telling customers:
“Prices are going up.”
A better approach is to improve the entire job economics.
Start with:
Accurate Estimates
↓
Efficient Labor
↓
Controlled Materials
↓
Fewer Callbacks
↓
Better Scope Control
↓
Smarter Service Mix
Then measure:
quoted margin
against:
actual margin.
If a job misses target:
find the reason.
Was it:
- labor;
- materials;
- discounts;
- callbacks;
- scope?
Then fix the process.
Small improvements matter.
If a £100,000-per-month company improves gross margin from:
35%
to:
40%
it creates:
£5,000 more gross profit per month
without increasing revenue.
That is why gross margin is one of the most powerful numbers in a service business.
Revenue tells you how much work you sold.
Gross margin tells you how much of that revenue remained available to run and grow the business.
Improve that number carefully, and the same amount of revenue can become much more valuable.



1 thought on “How to Improve Gross Margin in a Service Business Without Just Raising Prices”
Pingback: How to Calculate Marketing ROI for a Service Business