
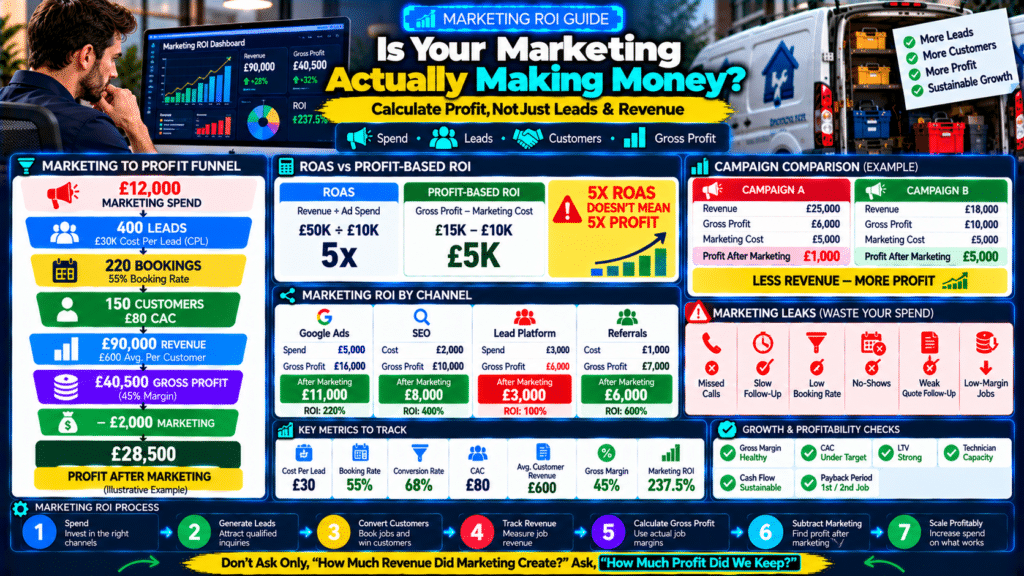
A service business can generate more leads, more calls, and even more revenue while still wasting money on marketing.
Imagine two campaigns.
Campaign A
Marketing spend:
£5,000
Revenue generated:
£25,000
Campaign B
Marketing spend:
£5,000
Revenue generated:
£18,000
At first glance:
Campaign A looks much better.
But what if Campaign A generated low-margin installation work while Campaign B generated highly profitable repair work?
For example:
Campaign A
Revenue:
£25,000
£6,000
Marketing spend:
£5,000
Gross profit after marketing:
£1,000
Campaign B
Revenue:
£18,000
Gross profit:
£10,000
Marketing spend:
£5,000
Gross profit after marketing:
£5,000
Campaign B generated less revenue.
But it created much more financial value.
That is why learning how to calculate marketing ROI for a service business requires more than looking at:
leads
or:
revenue.
A strong marketing measurement system connects:
Marketing Spend
↓
Leads
↓
Bookings
↓
Customers
↓
Revenue
↓
Gross Profit
↓
Marketing Cost
↓
Marketing ROI
The goal is not simply:
generate more leads.
The goal is:
generate profitable customers efficiently.
What Is Marketing ROI?
Marketing ROI measures how much financial return a business receives compared with the amount invested in marketing.
A simplified formula is:
(Return − Marketing Cost) ÷ Marketing Cost × 100
But the difficult part is deciding:
what should count as return?
You could use:
- revenue;
- gross profit;
- contribution after marketing.
For many service businesses, gross-profit-based marketing ROI gives a much more useful picture than revenue alone.
Revenue ROI vs Gross Profit ROI
Consider:
Marketing spend:
£10,000
Revenue generated:
£50,000
Revenue ROAS:
5x
That sounds excellent.
But suppose gross margin is:
30%
Gross profit:
£15,000
After marketing spend:
£5,000
remains.
The campaign is still positive.
But it is nowhere near as profitable as the:
5x revenue number
might suggest.
ROAS Is Not the Same as Marketing ROI
These terms are often confused.
ROAS
Return on Ad Spend.
Formula:
Revenue Attributed to Ads ÷ Ad Spend
Example:
Revenue:
£40,000
Ad spend:
£8,000
ROAS:
5x
Marketing ROI
Looks at the profit created relative to marketing cost.
A simplified gross-profit approach:
(Gross Profit − Marketing Cost) ÷ Marketing Cost × 100
Suppose gross profit:
£16,000
Marketing cost:
£8,000
Marketing ROI:
100%
Both metrics are useful.
They answer different questions.
Why Revenue ROAS Can Mislead Service Businesses
Suppose two services generate the same:
5x ROAS.
Service A
Revenue:
£50K
Ad spend:
£10K
Gross margin:
20%
Gross profit:
£10K
After marketing:
£0
Service B
Revenue:
£50K
Ad spend:
£10K
Gross margin:
50%
Gross profit:
£25K
After marketing:
£15K
Same ROAS.
Completely different economics.
That is why service businesses should connect marketing data with:
job profitability.
Step 1: Define the Marketing Cost
Start with what you are actually spending.
Possible costs include:
- Google Ads;
- Meta Ads;
- SEO;
- lead-generation platforms;
- direct mail;
- agency fees;
- website campaigns;
- call-tracking software.
For a fuller calculation, you may also include:
- sales staff;
- CRM costs;
- creative work.
Be consistent.
Simple vs Fully Loaded Marketing Cost
Simple Marketing Cost
Direct media and campaign spending.
Fully Loaded Marketing Cost
Direct spend + agency + marketing software + relevant sales costs.
Both can be useful.
Just label them clearly.
Example
Google Ads:
£6,000
Agency:
£1,500
Call tracking:
£300
Landing page / creative:
£700
Total campaign cost:
£8,500
That gives you a more realistic starting point.
Step 2: Track Leads
Suppose:
Marketing spend:
£8,500
Leads generated:
250
Cost per lead:
£8,500 ÷ 250
=
£34
Useful.
But we still do not know whether those leads became customers.
Step 3: Track Bookings
Out of:
250 leads
suppose:
150 book appointments.
Booking rate:
150 ÷ 250
=
60%
Cost per booking:
£8,500 ÷ 150
=
approximately:
£56.67
Now you are closer to actual business results.
Step 4: Track New Customers
Suppose:
150 bookings.
120 become paying customers.
Customer acquisition cost:
£8,500 ÷ 120
=
approximately:
£70.83
Now you have:
- CPL;
- cost per booking;
- CAC.
But marketing ROI still requires:
financial output.
Step 5: Track Revenue From Those Customers
Suppose the 120 new customers generate:
£72,000 first-job revenue.
Average revenue/customer:
£600
Revenue ROAS:
£72,000 ÷ £8,500
=
approximately:
8.47x
That looks strong.
But now check margin.
Step 6: Calculate Gross Profit
Suppose average gross margin:
45%.
Gross profit:
£72,000 × 45%
=
£32,400
Now subtract marketing cost:
£32,400 − £8,500
=
£23,900
That is the campaign’s gross profit after marketing expense under this simplified model.
Step 7: Calculate Gross-Profit-Based Marketing ROI
Formula:
(Gross Profit − Marketing Cost) ÷ Marketing Cost × 100
Using:
Gross profit:
£32,400
Marketing cost:
£8,500
ROI:
£23,900 ÷ £8,500 × 100
=
approximately:
281%
This means the campaign produced roughly:
£2.81 of gross profit after marketing
for every £1 of marketing cost under this simplified calculation.
Marketing ROI Formula
A practical formula:
Marketing ROI = (Attributed Gross Profit − Marketing Cost) ÷ Marketing Cost × 100
Use:
gross profit
rather than revenue when you want a more realistic profitability view.
Revenue-Based Marketing Return
You may also track:
Attributed Revenue ÷ Marketing Cost
This is useful for:
- media optimization.
Just do not confuse it with:
profitability.
Step 8: Calculate Marketing Contribution
Another simple metric:
Gross Profit − Marketing Cost
Example:
Gross profit:
£32,400
Marketing:
£8,500
Contribution after marketing:
£23,900
This can be easier for owners to understand than percentages.
Step 9: Calculate ROI by Channel
Do not only calculate blended marketing ROI.
Compare channels.
Example:
| Channel | Spend | Revenue | Gross Profit | GP After Marketing |
|---|---|---|---|---|
| Google Ads | £6K | £30K | £14K | £8K |
| SEO | £2K | £18K | £9K | £7K |
| Lead Platform | £3K | £12K | £5K | £2K |
| Referrals | £1K | £10K | £6K | £5K |
Now the picture becomes clearer.
High Revenue Does Not Always Mean Best Channel
Google Ads:
Revenue:
£30K
SEO:
Revenue:
£18K
But:
Google Ads contribution after marketing:
£8K
SEO:
£7K
Google Ads still leads here.
But the difference is much smaller than revenue alone suggests.
Step 10: Calculate ROI by Service
A channel may perform well for one service and badly for another.
Example:
Google Ads — Emergency Plumbing
Spend:
£3K
Gross profit:
£12K
Very attractive.
Google Ads — Large Installation
Spend:
£3K
Gross profit:
£4K
Much weaker.
Do not judge:
Google Ads
as one thing.
Analyze:
channel + service.
Step 11: Calculate ROI by Location
You may discover:
Area A
Marketing spend:
£2K
GP after marketing:
£8K
Area B
Spend:
£2K
GP after marketing:
£1K
Possible causes:
- competition;
- travel;
- weak conversion.
Location matters.
Step 12: Track First-Job ROI Separately
A campaign can be profitable on the first transaction.
Example:
CAC:
£100
First-job gross profit:
£350
Gross profit after acquisition:
£250
This is strong.
But first-job ROI may underestimate long-term customer value.
Step 13: Include Customer Lifetime Value
Suppose CAC:
£150
First-job gross profit:
£300
Lifetime gross profit:
£1,100
Then long-term marketing economics are much stronger than the first job alone suggests.
This connects directly with customer lifetime value.
First-Job ROI vs Lifetime ROI
First-Job View
Marketing spend:
£10K
First-job gross profit:
£20K
Contribution:
£10K
Lifetime View
Those same customers eventually produce:
£60K lifetime gross profit.
Long-term contribution:
£50K
Both views matter.
Do Not Use Lifetime Value Without Evidence
Avoid saying:
Every customer is worth £5,000 eventually.
unless your historical data supports it.
Use:
- cohort data;
- repeat purchase history.
Overstated LTV makes weak marketing look profitable.
Step 14: Track Marketing Payback Period
Ask:
How long does it take to recover marketing cost?
Suppose:
CAC:
£300
Gross profit per month from recurring service:
£75
Payback:
4 months
Shorter payback generally reduces growth risk.
Marketing ROI and Cash Flow
A campaign may have excellent lifetime ROI.
But if:
- you spend £20K today;
- customer profit arrives over 24 months;
growth requires cash.
Check your:
13-week cash flow forecast.
Profitable marketing can still create cash pressure.
Step 15: Calculate Lead-to-Customer Conversion Rate
Formula:
New Customers ÷ Leads × 100
Example:
300 leads.
90 customers.
Conversion:
30%
Improving conversion can improve marketing ROI dramatically without increasing ad spend.
Conversion Example
Marketing spend:
£10K
Leads:
200
At 20% Conversion
40 customers.
CAC:
£250
At 35% Conversion
70 customers.
CAC:
£142.86
Same spend.
Same number of leads.
Much better economics.
Step 16: Track Call Answer Rate
For many trades, phone calls are high-intent leads.
Suppose ads generate:
100 calls.
Only:
75 answered.
25% of opportunities may be leaking before sales even begins.
Track:
Answered Calls ÷ Total Calls × 100
Improving call handling can increase ROI.
Step 17: Track Speed to Lead
The faster a high-intent lead receives a response:
the better the chance of booking may be.
If leads sit unanswered for hours:
marketing spend is being wasted.
Use:
- call alerts;
- SMS;
- CRM automation.
Step 18: Track Booking Rate
Formula:
Bookings ÷ Qualified Leads × 100
Example:
Qualified leads:
150
Bookings:
105
Booking rate:
70%
If booking rate drops:
marketing may not be the problem.
Office handling may be.
Step 19: Track Quote Conversion
For estimate-driven work:
Accepted Quotes ÷ Quotes Sent × 100
Example:
50 estimates.
20 accepted.
Quote conversion:
40%
If lead quality is good but quote conversion weak:
improve:
- follow-up;
- pricing;
- sales process.
Step 20: Track No-Shows and Cancellations
Paid marketing can produce:
bookings
that never become:
revenue.
Example:
100 appointments.
20 no-show/cancel.
Only 80 customers.
CAC should ideally use:
actual paying customers.
Step 21: Track Refunds and Credits
Marketing-generated revenue can be overstated if many customers later receive:
- refunds;
- credits.
For mature analysis:
use:
net revenue and actual gross profit.
Step 22: Track Callbacks
Campaign A may generate customers for a service with high callback cost.
Those callbacks reduce:
- customer profitability;
- marketing ROI.
Connect marketing to:
job quality.
Step 23: Compare Marketing ROI With Capacity
Suppose Google Ads are extremely profitable.
But technician utilization:
92%
and customer wait time:
14 days.
Increasing spend may not be the right move.
The next bottleneck is:
capacity.
Marketing should not outgrow operations.
Step 24: Compare Marketing ROI With Technician Availability
Suppose you have:
200 unused technician hours/month.
A profitable marketing campaign could fill that capacity.
This may create strong incremental profit because:
- vans;
- payroll
already exist.
Capacity matters when deciding how aggressively to scale.
Step 25: Use Incremental ROI
Sometimes the question is not:
Is marketing profitable?
It is:
Will the next £1,000 of marketing be profitable?
Suppose:
First £5K spend:
excellent.
Next £5K:
moderate.
Next £5K:
weak.
Marketing returns often decline as spending increases.
Track marginal performance.
Example
Spend £5K
GP after marketing:
£10K
Spend £10K
GP after marketing:
£16K
Spend £15K
GP after marketing:
£18K
The additional £5K from:
£10K → £15K
only added:
£2K contribution.
That incremental spend may not be worthwhile.
Step 26: Do Not Scale Based on Average ROI Alone
Average campaign looks good.
But incremental dollars may be weaker.
Increase budget gradually and monitor:
- CAC;
- conversion;
- gross profit.
Step 27: Track Branded vs Non-Branded Marketing
A customer searching your exact company name may already know you.
Do not always credit that conversion the same way as:
new customer discovery.
Where practical, separate:
- branded;
- non-branded.
This helps evaluate true acquisition.
Step 28: Understand Attribution
Marketing attribution is rarely perfect.
A customer might:
see Facebook ad
↓
search Google
↓
read reviews
↓
return through organic search
↓
call.
Which channel deserves credit?
There may not be one perfect answer.
Use:
- consistent attribution.
Common Attribution Models
First Touch
Credits the first source.
Last Touch
Credits the final source before conversion.
Multi-Touch
Shares credit.
Small businesses do not need overly complex models immediately.
Consistency is more important.
Step 29: Ask Customers How They Found You
This remains useful.
Add:
How did you hear about us?
Options:
- Google;
- Referral;
- Facebook;
- Repeat Customer;
- Other.
Compare customer answers with analytics.
Neither source is perfect.
Together they improve confidence.
Step 30: Connect Marketing Source to CRM
Each lead should ideally include:
Source
↓
Customer
↓
Job
↓
Revenue
↓
Gross Profit
Without this connection, true marketing profitability is difficult to calculate.
Marketing ROI Dashboard
A useful dashboard might show:
Marketing Spend
Leads
CPL
Bookings
New Customers
CAC
Revenue
Gross Profit
GP After Marketing
Marketing ROI
LTV:CAC
Payback
This tells the full story.
Example Dashboard
Marketing spend:
£12,000
Leads:
400
CPL:
£30
Bookings:
220
New customers:
150
CAC:
£80
Revenue:
£90,000
Gross profit:
£40,500
GP after marketing:
£28,500
Gross-profit-based ROI:
237.5%
Lifetime GP:
£120,000
Mark these numbers:
Illustrative Example
Marketing Funnel Example
£12K Marketing
↓
400 Leads
↓
220 Bookings
↓
150 Customers
↓
£90K Revenue
↓
£40.5K Gross Profit
↓
£28.5K After Marketing
This makes the economics easy to understand.
Compare Four Marketing Channels
Google Ads
Spend:
£5K
Customers:
40
CAC:
£125
Gross profit:
£16K
After marketing:
£11K
SEO
Cost:
£2K
Customers:
30
CAC:
£66.67
Gross profit:
£10K
After marketing:
£8K
Lead Platform
Spend:
£3K
Customers:
15
CAC:
£200
Gross profit:
£6K
After marketing:
£3K
Referrals
Cost:
£1K
Customers:
15
CAC:
£66.67
Gross profit:
£7K
After marketing:
£6K
All channels produce customers.
But their economics differ.
Should You Stop a Channel With Lower ROI?
Not automatically.
Consider:
- customer volume;
- customer quality;
- seasonality;
- strategic value.
One channel may have lower ROI but still produce:
£20K additional gross profit.
It can still be worth keeping.
ROI Percentage vs Total Profit
Campaign A:
ROI:
500%
Contribution:
£2K
Campaign B:
ROI:
150%
Contribution:
£20K
Which is better?
Depends on your:
- growth goal;
- cash;
- capacity.
Percentage and absolute profit both matter.
Step 31: Set a Minimum Marketing Return
Instead of saying:
Marketing needs to work.
Define a target.
Example:
Minimum requirement:
Every:
£1 marketing spend
should create:
£3 gross profit before marketing.
Or:
target CAC should remain under:
£150.
Your thresholds should come from your actual economics.
Build Targets From Customer Value
Suppose:
Average first-year gross profit/customer:
£750
Business allows:
25%
for acquisition.
Maximum CAC:
£187.50
Now the marketing target has a financial basis.
Step 32: Use Marketing ROI in Monthly Budgeting
Suppose marketing budget:
£15K
Expected CAC:
£150
Expected new customers:
100
Expected average first-job revenue:
£700
Forecast new-customer revenue:
£70K
This can feed directly into:
- monthly revenue budget;
- technician capacity.
Step 33: Connect Marketing Budget to Capacity
100 customers may require:
250 technician hours.
Do you have them?
If not:
marketing and staffing plans do not match.
A financially strong campaign can still overwhelm operations.
Step 34: Compare Marketing ROI With Break-Even
If the business is below break-even:
profitable marketing can help fill capacity.
But only if jobs produce enough:
gross margin.
Low-margin revenue may not solve the problem.
Step 35: Compare Marketing ROI With Cash Reserve
Scaling marketing from:
£10K
to:
£30K
may be profitable eventually.
But do you have:
- cash;
- reserve
to fund it?
Growth should not create a payroll crisis.
Marketing ROI and Customer Lifetime Value
A channel may look mediocre on first-job profit but excellent over the lifetime.
Example:
First-job GP after CAC:
£50
Lifetime GP after CAC:
£1,000
That channel may deserve patience.
Use:
first-job ROI
and:
lifetime ROI
separately.
Marketing ROI and Repeat Customers
Existing-customer marketing often has lower cost.
Example:
Email/SMS reactivation campaign:
Cost:
£500
Gross profit generated:
£5,000
Very strong return.
Retention marketing should not be ignored.
Marketing ROI and Referral Programs
Referral incentive:
£50
New referred customer lifetime GP:
£900
That can be attractive.
Again:
calculate actual numbers.
Marketing ROI and Local SEO
SEO may involve upfront and ongoing costs.
Returns may take months.
Monthly ROI can look weak early.
Use:
- 6-month;
- 12-month
measurement where appropriate.
Short-term analysis can underestimate long-term channels.
Marketing ROI and Paid Ads
Paid ads often produce faster feedback.
You can measure:
- spend;
- calls;
- bookings;
- jobs
more quickly.
But paid ads can stop producing the moment spending stops.
This is different from:
- organic visibility.
Use a balanced channel mix.
Marketing ROI and Brand Building
Not every marketing activity has perfect direct attribution.
Branding can influence:
- direct searches;
- referrals;
- conversion.
Do not pretend every pound can always be tied to:
one sale.
Some marketing requires broader measurement.
What About Word-of-Mouth?
Word-of-mouth may have:
low direct acquisition cost.
But it often comes from:
- great service;
- reputation;
- previous marketing.
Track it as its own source where possible.
Step 36: Track Rolling Marketing ROI
One month can be noisy.
Use:
3-month
or:
6-month rolling results.
Especially for:
- SEO;
- commercial sales.
This provides a more stable view.
Step 37: Compare Year Over Year
October this year:
CAC:
£120
October last year:
£150
Gross profit/customer:
£550 vs £450.
Marketing economics improved significantly.
Seasonal comparisons can be more useful than:
September vs October.
Step 38: Track Marketing Leakage
Marketing ROI problems often come after the lead arrives.
Common leaks:
↓
Slow Follow-Up
↓
Poor Booking
↓
No-Shows
↓
Weak Quote Follow-Up
↓
Low Conversion
Before cutting advertising:
check the entire funnel.
Example Funnel Leak
Spend:
£10K.
Leads:
Only 50% of calls answered.
If call answer rate improves to:
80%,
you may generate many more customers with:
the same marketing budget.
That can dramatically improve ROI.
Step 39: Improve Marketing ROI Without Reducing Spend
You can improve ROI by:
Better Targeting
Higher-quality leads.
Better Website Conversion
More inquiries from same traffic.
Faster Lead Response
More bookings.
Better Call Handling
More leads become customers.
Quote Follow-Up
More estimates convert.
Better Pricing
More gross profit/customer.
Better Retention
Higher lifetime value.
Fewer Callbacks
Protect customer profit.
Marketing profitability is a whole-company metric.
Step 40: Scale What Works Carefully
When a channel works:
do not immediately triple spending.
Increase gradually.
Track:
- CAC;
- margin;
- capacity;
- cash.
Marketing performance may change at higher spending levels.
Common Marketing ROI Mistakes
Tracking Revenue Only
Ignores job costs.
Using ROAS as Profit
They are not the same.
Ignoring Agency Costs
Understates true spend.
Tracking Leads Instead of Customers
Leads do not pay invoices.
Ignoring Gross Margin
Low-margin work can create weak returns.
Ignoring Repeat Business
Can underestimate value.
Using Unrealistic LTV
Can make bad marketing look good.
Ignoring No-Shows
Bookings are not customers.
Ignoring Capacity
Marketing can exceed operational ability.
Ignoring Cash Flow
Profitable campaigns still require funding.
Stopping SEO Too Early
Longer-term channels need proper measurement windows.
Scaling Too Fast
Incremental returns may decline.
Marketing ROI Checklist
Track:
- Marketing spend
- Agency / software costs
- Leads
- Cost per lead
- Bookings
- Booking rate
- New paying customers
- Customer acquisition cost
- Attributed revenue
- Gross profit
- Gross profit after marketing
- Marketing ROI
- ROI by channel
- ROI by service
- Quote conversion
- No-shows
- Customer lifetime value
- Payback period
- Technician capacity
- Cash-flow impact
Sources and Further Reading
These official resources back up the methods in this guide and are worth reading alongside it.
- Marketing and sales (U.S. Small Business Administration): planning and measuring marketing for a small business.
- Manage your finances (U.S. Small Business Administration): bookkeeping, financial statements and cash flow basics.
- Write your business plan (U.S. Small Business Administration): building financial projections.
Related guides
- How to Build Service Pages That Rank on Google in 2026
- Local SEO for Trades: A Practical Small-Business Guide
- Best Local SEO Tools for Service Businesses in 2026: 6 Tools Compared
- Tools, Software and Automation for Trades: Start Here
Frequently Asked Questions
What is marketing ROI?
Marketing ROI measures the financial return generated relative to marketing investment.
How do you calculate marketing ROI for a service business?
A useful gross-profit approach is:
(Attributed Gross Profit − Marketing Cost) ÷ Marketing Cost × 100
Is ROAS the same as marketing ROI?
No.
ROAS usually compares:
revenue
with:
advertising spend.
Marketing ROI aims to measure:
profitability.
Should I use revenue or gross profit to calculate marketing ROI?
Revenue is useful for ROAS.
Gross profit is generally more useful for understanding whether marketing is financially worthwhile.
What is a good marketing ROI?
There is no universal percentage.
Your target depends on:
- gross margin;
- overhead;
- customer lifetime value;
- cash flow.
Should agency fees be included?
Yes, for a more complete view of campaign cost.
Should customer lifetime value be included?
Track both:
- first-job return;
- lifetime return.
Do not rely on unproven lifetime assumptions.
How often should marketing ROI be reviewed?
Paid campaigns can often be reviewed:
- weekly;
- monthly.
Longer-term channels such as SEO may need:
- quarterly;
- rolling-period analysis.
Why can high ROAS still be unprofitable?
Because revenue may have:
- low gross margin.
A 5x ROAS does not automatically mean strong profit.
Can marketing ROI improve without reducing ad spend?
Yes.
Improve:
- lead conversion;
- call answering;
- quote follow-up;
- job margins;
- customer retention.
Conclusion
Learning how to calculate marketing ROI for a service business changes marketing from:
“How many leads did we get?”
to:
“How much profitable value did our marketing create?”
A strong measurement chain looks like:
Marketing Spend
↓
Leads
↓
Bookings
↓
New Customers
↓
Revenue
↓
Gross Profit
↓
Marketing Cost
↓
Profit After Marketing
Then add:
Customer Lifetime Value
for the long-term picture.
For example:
Marketing spend:
£12K
Revenue generated:
£90K
Gross profit:
£40.5K
Gross profit after marketing:
£28.5K
That tells you far more than:
7.5x revenue ROAS.
Then break performance down by:
- channel;
- service;
- location;
- customer type.
Do not automatically scale the channel with:
the cheapest lead.
Scale the channel that produces:
profitable customers
at a cost the business can support.
And before increasing spend, check:
- technician capacity;
- cash flow;
- gross margin.
The best marketing strategy is not the one producing the most:
clicks
or even:
revenue.
It is the one that consistently turns marketing investment into:
healthy gross profit, valuable customers, and sustainable business growth.