
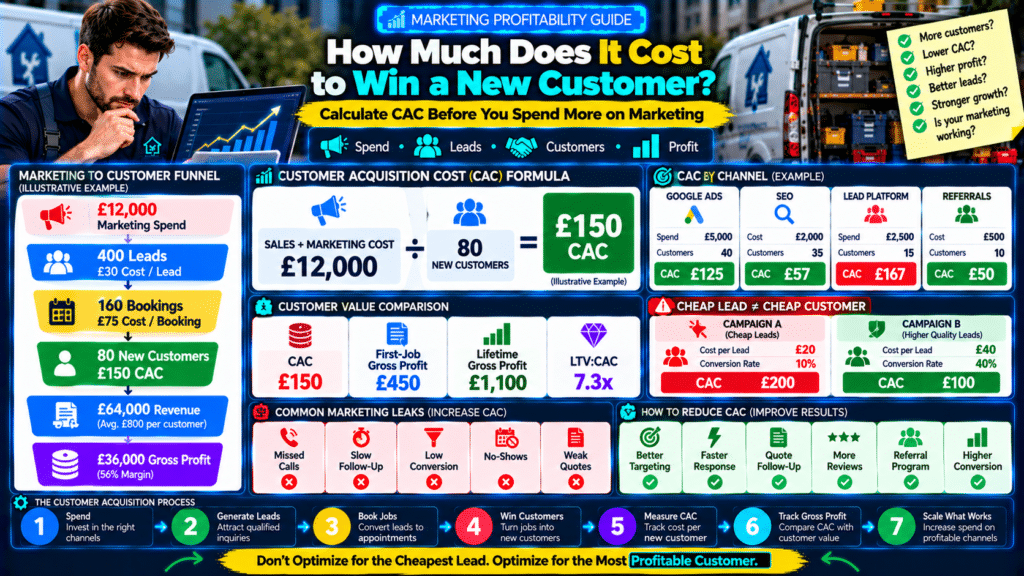
A service business can generate lots of leads and still have poor marketing economics.
Imagine two companies.
Company A
Spends:
£5,000 on marketing
and wins:
50 new customers.
Customer acquisition cost:
£100
Company B
Spends:
£5,000
and wins:
20 new customers.
Customer acquisition cost:
£250
Company A appears more efficient.
But that still does not tell the full story.
What if Company A’s customers only buy:
£150 jobs
while Company B’s customers generate:
£2,000 of gross profit over time?
That is why customer acquisition cost for a service business should never be viewed in isolation.
A stronger marketing model connects:
Marketing Spend
↓
Leads
↓
Booked Jobs
↓
New Customers
↓
Customer Acquisition Cost
↓
Gross Profit
↓
Customer Lifetime Value
The goal is not simply:
get cheaper leads.
The goal is:
acquire profitable customers at a sustainable cost.
What Is Customer Acquisition Cost?
Customer acquisition cost, usually shortened to:
CAC
measures how much a business spends to acquire a new customer.
A simple formula is:
Sales + Marketing Costs ÷ New Customers Acquired = CAC
For example:
Marketing and sales costs:
£8,000
New customers:
80
CAC:
£100
That means the business spent an average of:
£100
to acquire each new customer.
Why CAC Matters
Marketing should not only generate:
- clicks;
- calls;
- leads.
It should generate:
profitable customers.
CAC helps answer:
How much are we paying to win each new customer?
Once you know that, you can compare it with:
- first job gross profit;
- repeat revenue;
- customer lifetime value.
That is much more useful than looking at:
cost per lead alone.
CAC vs Cost Per Lead
These are different.
Cost Per Lead
Formula:
Marketing Spend ÷ Leads
Example:
£5,000 spend.
250 leads.
Cost per lead:
£20
Customer Acquisition Cost
Suppose only:
50 of those leads become new customers.
CAC:
£5,000 ÷ 50 = £100
The £20 lead looked cheap.
But the real customer acquisition cost was:
£100.
Why Cost Per Lead Can Mislead You
Consider two campaigns.
Campaign A
Cost per lead:
£20
Lead-to-customer conversion:
10%
Campaign B
Cost per lead:
£40
Lead-to-customer conversion:
40%
For 100 leads:
A
Marketing spend:
£2,000
Customers:
10
CAC:
£200
B
Marketing spend:
£4,000
Customers:
40
CAC:
£100
Campaign B has:
twice the lead cost
but:
half the acquisition cost.
Cheap leads are not always better leads.
Step 1: Decide What Costs to Include
For a simple marketing CAC, you might include:
- advertising;
- SEO;
- lead generation platforms;
- marketing agency fees;
- sales software.
For a fuller CAC, you may also include:
- sales staff wages;
- sales commissions;
- call tracking;
- marketing technology;
- creative production.
The important thing is to define the metric consistently.
Simple CAC vs Fully Loaded CAC
Simple CAC
Marketing spend only.
Fully Loaded CAC
Marketing + sales costs.
Both can be useful.
Just label them clearly.
Example
Marketing Costs
Google Ads:
£4,000
SEO:
£1,500
Lead platform:
£500
Total:
£6,000
Sales Costs
Sales wages allocated:
£2,000
CRM / phone:
£500
Total:
£2,500
Fully loaded acquisition spend:
£8,500
New customers:
85
Fully loaded CAC:
£100
Step 2: Count New Customers Correctly
Do not divide acquisition spend by:
all customers.
Use:
new customers acquired during the relevant period.
If you served:
150 customers
but:
70 were existing customers,
new customers:
80
Use:
80
for CAC.
Existing Customers Should Usually Be Separated
Repeat customers often require less acquisition spend.
Mixing:
- new;
- repeat
can make marketing look more efficient than it really is.
Track both.
Step 3: Match the Time Period
Use costs and customers from the same period where practical.
Example:
October acquisition spend:
£10K
New customers:
100
October CAC:
£100
But be careful with:
- SEO;
- long sales cycles.
Some marketing spend produces customers later.
For those channels, longer reporting periods may be more useful.
Step 4: Calculate Overall CAC
Formula:
Total Acquisition Spend ÷ New Customers
Example:
Marketing + sales:
£12,000
New customers:
100
CAC:
£120
Now you have a company-level benchmark.
Step 5: Calculate CAC by Channel
This is where the metric becomes more useful.
Example:
Google Ads
Spend:
£5,000
New customers:
40
CAC:
£125
SEO
Allocated cost:
£2,000
New customers:
35
CAC:
£57.14
Local Service Platform
Spend:
£2,500
New customers:
15
CAC:
£166.67
Referrals
Cost:
£500
New customers:
10
CAC:
£50
Now you know which channels acquire customers most efficiently.
But Do Not Choose Channels Using CAC Alone
Suppose:
Referrals
CAC:
£50
Average first-job gross profit:
£150
Google Ads
CAC:
£125
Average first-job gross profit:
£600
Google Ads costs more.
But may generate more economic value.
You need:
CAC + customer value.
Step 6: Compare CAC With First-Job Gross Profit
Suppose:
CAC:
£100
Average first job:
£500 revenue.
40%.
Gross profit:
£200
First-job gross profit after acquisition cost:
£100
That is a useful number.
First-Job Acquisition Payback
Formula:
First-Job Gross Profit − CAC
Example:
Gross profit:
£200
CAC:
£100
Remaining:
£100
The customer has already recovered acquisition cost on the first job.
That can be attractive.
Negative First-Job Payback Can Still Work
Suppose:
CAC:
£150
First-job gross profit:
£100
Loss after CAC:
−£50
But customer later generates:
£1,000 gross profit
through repeat work.
Acquiring that customer may still be excellent.
This is why:
Customer Lifetime Value
matters.
Step 7: Compare CAC With Customer Lifetime Value
A simplified customer lifetime value model might consider:
Average Customer Gross Profit × Expected Number of Purchases
Example:
Average gross profit per purchase:
£250
Average purchases:
4
Estimated lifetime gross profit:
£1,000
CAC:
£100
LTV:CAC:
10:1
This can indicate strong economics.
But only if the lifetime value estimate is realistic.
Do Not Use Revenue-Based LTV Without Context
Suppose customer lifetime revenue:
£2,000
Sounds strong.
But if gross margin:
20%,
gross profit:
£400
That is the more relevant value when comparing against CAC.
Use:
gross profit-based lifetime value
where possible.
Step 8: Calculate LTV:CAC Ratio
Formula:
Customer Lifetime Value ÷ CAC
Example:
Lifetime gross profit:
£900
CAC:
£150
Ratio:
6:1
This means the estimated gross profit value of the customer is six times acquisition cost.
Do not treat one ratio as universally ideal.
Different service businesses have different:
- cash flow;
- repeat purchase behavior;
- margins.
Step 9: Calculate CAC Payback Period
CAC payback asks:
How long until gross profit generated by the customer recovers acquisition cost?
Example:
CAC:
£200
Average monthly gross profit from recurring service:
£50
Payback:
4 months
This is particularly useful for:
- cleaning;
- maintenance plans;
- recurring service companies.
Shorter Payback Usually Reduces Risk
If acquisition cost is recovered quickly:
the business can reinvest marketing cash sooner.
Long payback periods require:
- more working capital;
- stronger retention.
Step 10: Track CAC by Service
Different services may have different acquisition economics.
Example:
Emergency Plumbing
CAC:
£90
Average job gross profit:
£280
Boiler Installation
CAC:
£250
Average job gross profit:
£1,200
Annual Maintenance
CAC:
£110
First-year gross profit:
£300
All three may be attractive for different reasons.
Step 11: Track CAC by Customer Type
Example:
Residential
CAC:
£95
Commercial
CAC:
£350
Commercial CAC is much higher.
But commercial customers may have:
- larger contracts;
- repeat work.
Higher acquisition cost is not automatically bad.
Step 12: Track CAC by Geography
You may discover:
Zone A
CAC:
£80
Zone B
CAC:
£140
Zone C
CAC:
£260
Why?
Possible reasons:
- competition;
- distance;
- weak conversion.
This can help improve local marketing.
Step 13: Track CAC by Lead Source
Examples:
- Google Ads;
- organic search;
- referrals;
- Facebook;
- local directories;
- email;
- partnerships.
Do not combine everything into one number if channel decisions matter.
Step 14: Include Lead Conversion Rate
Formula:
New Customers ÷ Leads × 100
Example:
Leads:
200
Customers:
50
Conversion:
25%
If CAC is high:
your marketing may not be the problem.
Maybe:
conversion is weak.
Example
Ad spend:
£5K
Leads:
100
Cost per lead:
£50
Customers:
20
CAC:
£250
Improve conversion from:
20%
to:
30%
Customers become:
30
CAC becomes:
£166.67
Same ad spend.
Same leads.
Much better acquisition cost.
Step 15: Improve Speed to Lead
A customer calling for:
- plumber;
- electrician;
- HVAC repair
may contact multiple companies.
If you respond slowly:
conversion can fall.
Better lead handling can improve CAC without reducing ad spend.
Step 16: Improve Call Answer Rate
Marketing can generate expensive leads.
If nobody answers:
that spend is wasted.
Track:
Calls Answered ÷ Inbound Calls
Suppose:
20% of calls are missed.
Improving phone coverage may reduce acquisition cost significantly.
Step 17: Track Missed-Call Recovery
If a lead calls and nobody answers:
use:
- callback workflow;
- SMS.
Recovering missed leads can improve marketing economics.
Step 18: Improve Quote Follow-Up
Marketing cost has already been spent when the quote is issued.
If quotes are not followed up:
CAC rises.
Example:
100 leads.
40 estimates.
10 customers.
Improve estimate conversion to:
15 customers.
Same marketing spend.
Lower CAC.
Step 19: Improve Lead Qualification
Not every lead is useful.
Bad leads may include:
- outside service area;
- wrong service;
- unrealistic budget.
Improve:
- website messaging;
- campaign targeting.
Better lead quality can improve CAC.
Step 20: Do Not Optimize for Cheap Leads
A cheap lead can still be expensive if:
- poor conversion;
- low job value;
- high cancellation.
Track:
lead → customer → gross profit
not only:
cost per lead.
Channel Example
Channel A
CPL:
£25
Customer conversion:
10%
CAC:
£250
Average gross profit/customer:
£300
Channel B
CPL:
£60
Conversion:
40%
CAC:
£150
Average gross profit/customer:
£700
Channel B looks much stronger despite the expensive leads.
Step 21: Include Marketing Agency Fees
If Google Ads spend is:
£5K
but agency fee:
£1K
total acquisition cost should often include:
£6K
for channel evaluation.
Otherwise CAC looks artificially low.
Step 22: Include Promotional Discounts Carefully
Suppose new customers receive:
£50 discount.
That is part of the economic cost of acquisition.
Whether you classify it inside CAC or gross profit:
be consistent.
Do not ignore it.
Step 23: Track CAC Trend
Example:
January:
£95
February:
£105
March:
£130
April:
£160
CAC is rising.
Why?
Possible causes:
- ads more expensive;
- conversion falling;
- lead quality weaker.
Trend matters more than one month.
Step 24: Track CAC Against Gross Margin
If gross margin declines:
the same CAC becomes more expensive relative to customer value.
Example:
CAC:
£150
At 50% Margin
£1,000 job gross profit:
£500
At 25% Margin
Gross profit:
£250
Acquisition cost now consumes:
60% of gross profit.
Marketing and margin must be reviewed together.
Step 25: Track CAC Against Capacity
Suppose CAC is excellent.
But technicians are fully booked.
Spending more on marketing may simply create:
- longer wait times;
- lost leads.
Marketing spend should match:
available field capacity.
Example
Current utilization:
90%
Appointment wait:
12 days
CAC:
£80
Increasing ad spend may not be the next best decision.
Maybe:
- hire;
- expand capacity
first.
Step 26: Track CAC Against No-Shows
Suppose paid leads book appointments but often no-show.
Marketing acquired:
a booking
not:
a paying customer.
Use:
new paying customers
where practical.
That gives a more realistic acquisition cost.
Step 27: Track CAC Against Cancellations
Lead source A may generate:
cheap bookings.
But:
30% cancel.
Lead source B:
higher CPL.
But:
5% cancel.
Evaluate final customer economics.
Step 28: Track New vs Repeat Revenue
Marketing should create new customers.
But retention turns acquisition into long-term value.
Track:
New Customer Revenue
and:
Repeat Customer Revenue
separately.
If repeat revenue is growing:
CAC may support long-term profitability.
Step 29: Calculate Blended CAC
Formula:
Total Sales & Marketing Spend ÷ Total New Customers
Example:
Spend:
£20K
New customers:
150
Blended CAC:
£133.33
This is useful for company-level performance.
Step 30: Calculate Paid CAC
Use paid channels only.
Example:
Paid advertising:
£12K
New customers from paid marketing:
80
Paid CAC:
£150
This helps isolate paid acquisition efficiency.
Step 31: Calculate Organic CAC Carefully
Organic is not:
free.
SEO may require:
- content;
- agency;
- website work.
If those costs are meaningful:
allocate them.
Step 32: Referrals Also Have Cost
Referral customers may have costs through:
- referral incentives;
- networking;
- partnerships.
Track them where practical.
Step 33: Separate Brand Marketing From Direct Acquisition
Some spending supports:
- awareness
rather than measurable short-term leads.
Do not force every pound into perfect direct attribution.
But understand:
what can be measured
and:
what cannot.
Attribution Is Imperfect
Customer journey may look like:
Google Search
↓
Website
↓
Facebook Retargeting
↓
Referral from Friend
↓
Phone Call
Which channel acquired the customer?
There may not be one perfect answer.
Use attribution models consistently.
Step 34: Ask Customers How They Found You
Even with analytics:
ask.
Example booking field:
How did you hear about us?
Options:
- Referral
- Repeat Customer
- Other
This provides useful supporting data.
Step 35: Connect CAC to the CRM
For every new customer, ideally track:
Lead Source
↓
Booked Job
↓
Revenue
↓
Gross Profit
This makes channel profitability much easier to analyze.
Marketing Funnel Dashboard
A useful funnel might show:
Marketing Spend: £10K
↓
500 Leads
CPL:
£20
↓
250 Bookings
Cost per Booking:
£40
↓
150 New Customers
CAC:
£66.67
↓
£90K Revenue
↓
£40K Gross Profit
Now you can evaluate the full funnel.
Add Gross Profit Return on Marketing
A useful metric:
Gross Profit Generated ÷ Acquisition Spend
Example:
Gross profit:
£40K
Marketing spend:
£10K
Gross profit return:
4x
This can be more useful than revenue ROAS for service businesses.
Revenue ROAS Can Mislead
Example:
Ad spend:
£10K
Revenue:
£50K
ROAS:
5x
Sounds great.
But if margin:
20%
gross profit:
£10K
Marketing spend:
£10K
You have little contribution remaining.
This is why gross profit matters.
Compare Channels Using Gross Profit
Example:
| Channel | CAC | Avg. Customer GP | GP After CAC |
|---|---|---|---|
| Google Ads | £150 | £600 | £450 |
| SEO | £80 | £400 | £320 |
| Referral | £50 | £300 | £250 |
| Lead Platform | £220 | £350 | £130 |
Now marketing decisions become clearer.
CAC and Customer Lifetime Value
Suppose:
Google Ads CAC:
£150
Lifetime gross profit:
£1,200
Very attractive.
Lead platform CAC:
£220
Lifetime gross profit:
£350
Much weaker.
Customer quality matters.
CAC and Recurring Services
Recurring businesses can often tolerate higher CAC.
Example:
Monthly gross profit/customer:
£60
Average retention:
24 months
Simplified lifetime gross profit:
£1,440
CAC:
£300
May still be financially attractive.
But cash payback takes time.
CAC and Emergency Services
Emergency services may recover CAC immediately.
Example:
CAC:
£100
First-job gross profit:
£400
Payback:
first job.
This can support faster marketing reinvestment.
CAC and Large Installations
Installations may have:
- higher CAC;
- bigger tickets.
Example:
CAC:
£300
Installation revenue:
£5,000
Gross profit:
£1,500
CAC as percentage of gross profit:
20%
Potentially attractive.
Calculate CAC as Percentage of Gross Profit
Formula:
CAC ÷ Customer Gross Profit × 100
Example:
CAC:
£150
Customer gross profit:
£600
CAC consumes:
25%
of first-job gross profit.
This is easy to understand.
Set CAC Targets Based on Economics
Do not choose:
“CAC must be under £100”
randomly.
Instead ask:
- What is customer gross profit?
- How often do they repeat?
- How quickly is CAC recovered?
Then set a maximum.
Example
Average first-year gross profit/customer:
£800
Business is comfortable spending up to:
20%
on acquisition.
Target CAC:
£160
Now the target has a financial basis.
CAC Can Rise and Still Be Healthy
Suppose CAC rises:
£100 → £130.
Bad?
Maybe not.
If customer gross profit rises:
£400 → £700,
economics improved.
Always compare cost with value.
CAC Can Fall and Still Be Bad
CAC falls:
£150 → £80.
Looks excellent.
But average customer gross profit falls:
£500 → £100.
Marketing may now be acquiring low-value customers.
Cheaper is not automatically better.
Create CAC Alert Levels
Example:
Target:
£120
Green
≤ £120
Yellow
£121–£160
Red
£160
Then combine with:
customer gross profit.
These are illustrative only.
CAC Dashboard
Track:
Marketing Spend
Leads
Cost per Lead
Bookings
New Customers
CAC
Average Customer Gross Profit
LTV
LTV:CAC
Payback Period
This gives a complete acquisition picture.
Example Dashboard
Marketing spend:
£12K
Leads:
400
CPL:
£30
New customers:
80
CAC:
£150
Average first-job gross profit:
£450
Lifetime gross profit:
£1,100
LTV:CAC:
7.3x
Payback:
First Job
Now management can make a better decision.
CAC and Budgeting
If monthly marketing budget is:
£15K
Target CAC:
£150
Expected new customers:
100
If average revenue/customer:
£800
expected first-job revenue:
£80K
This can feed into:
- monthly budget;
- technician capacity plan.
CAC and Technician Capacity
100 new customers may require:
150 technician hours.
Do you have that capacity?
If not:
your marketing plan and operations plan are misaligned.
CAC and Cash Flow
Suppose marketing spend:
£20K today
but customers pay over:
60 days.
The acquisition strategy may be profitable but cash-intensive.
Check:
13-week forecast.
Marketing growth must be fundable.
CAC and Cash Reserve
Aggressive customer acquisition may temporarily use cash.
Do not drain:
- payroll reserve;
- emergency reserve
without understanding the risk.
CAC and Break-Even
Your business needs enough:
gross profit after acquisition cost
to cover:
- overhead.
If acquisition cost rises:
break-even economics can worsen.
CAC and Pricing
Higher prices can improve customer gross profit and allow sustainable acquisition spend.
But only if:
- conversion;
- demand
remain healthy.
Pricing and marketing economics are connected.
CAC and Gross Margin
If you improve gross margin:
same customer becomes more valuable.
Example:
Job revenue:
£1,000
35% Margin
Gross profit:
£350
CAC:
£150
Profit after acquisition:
£200
45% Margin
Gross profit:
£450
Same CAC.
Remaining:
£300
Margin improvements increase marketing flexibility.
How to Reduce CAC Without Cutting Marketing
There are several ways.
1. Improve Lead Conversion
Same leads.
More customers.
CAC falls.
2. Answer Calls Faster
Fewer leads wasted.
3. Improve Website Conversion
More visitors become inquiries.
4. Improve Lead Quality
Better targeting.
5. Improve Quote Follow-Up
More estimates convert.
6. Reduce No-Shows
More bookings become paying customers.
7. Improve Reviews
Better trust can improve conversion.
8. Improve Referral Rate
Lower-cost acquisition source.
Do Not Slash Marketing Just Because CAC Rises
First ask:
why.
CAC may rise because:
- seasonality;
- competition;
- lower conversion.
Cutting marketing without analysis can reduce revenue further.
Find root cause.
Common CAC Mistakes
Using Leads Instead of Customers
That calculates CPL, not CAC.
Ignoring Sales Costs
Fully loaded CAC becomes understated.
Mixing Repeat and New Customers
Makes acquisition look cheaper.
Using Revenue Instead of Gross Profit
Customer value becomes overstated.
Ignoring Channel Differences
Blended average hides weak campaigns.
Optimizing Only for Cheap Leads
Cheap leads can be low quality.
Ignoring Repeat Business
Lifetime value is underestimated.
Ignoring Capacity
Marketing creates more work than technicians can handle.
Ignoring Cash Flow
Profitable marketing can still create short-term cash pressure.
Using One Month of Data
Small samples can be misleading.
Customer Acquisition Cost Checklist
Track:
- Marketing spend
- Sales costs where relevant
- Lead count
- Cost per lead
- Bookings
- New paying customers
- CAC
- CAC by channel
- Lead conversion rate
- Average first-job revenue
- Average first-job gross profit
- Repeat purchase rate
- Customer lifetime value
- LTV:CAC
- CAC payback
- Technician capacity
- Cash-flow impact
Sources and Further Reading
These official resources back up the methods in this guide and are worth reading alongside it.
- Marketing and sales (U.S. Small Business Administration): planning and measuring marketing for a small business.
- Manage your finances (U.S. Small Business Administration): bookkeeping, financial statements and cash flow basics.
Related guides
- How to Build Service Pages That Rank on Google in 2026
- Local SEO for Trades: A Practical Small-Business Guide
- Best Local SEO Tools for Service Businesses in 2026: 6 Tools Compared
- Tools, Software and Automation for Trades: Start Here
Frequently Asked Questions
What is customer acquisition cost?
Customer acquisition cost measures how much money a business spends to acquire a new customer.
How do you calculate CAC?
Use:
Sales + Marketing Costs ÷ New Customers Acquired
Is CAC the same as cost per lead?
No.
Cost per lead measures how much it costs to generate an inquiry.
CAC measures how much it costs to generate an actual new customer.
What is a good CAC for a service business?
There is no universal number.
CAC should be evaluated relative to:
- gross profit;
- lifetime value;
- payback period.
Should SEO costs be included in CAC?
They can be included when calculating organic acquisition cost or blended CAC.
Should sales salaries be included?
For fully loaded CAC, yes, where those sales costs relate to customer acquisition.
Is lower CAC always better?
No.
A higher-CAC customer may produce much more:
- gross profit;
- lifetime value.
How can I reduce CAC?
Improve:
- lead quality;
- conversion;
- call handling;
- quote follow-up;
- customer reviews.
Why should CAC be compared with gross profit instead of revenue?
Revenue does not account for the cost of delivering the service.
Gross profit gives a more realistic picture of customer value.
How often should CAC be reviewed?
Monthly is useful for many businesses, while longer rolling periods can help smooth volatility.
Conclusion
Understanding customer acquisition cost for a service business turns marketing from:
“How many leads did we get?”
into:
“How much did it cost us to acquire a profitable customer?”
Start with:
Marketing + Sales Cost
↓
Leads
↓
Bookings
↓
New Customers
↓
CAC
Then connect CAC to:
First-Job Gross Profit
↓
Repeat Business
↓
Customer Lifetime Value
For example:
Marketing spend:
£12,000
New customers:
80
CAC:
£150
If average lifetime gross profit is:
£1,100
that may be very healthy.
But if average customer gross profit is only:
£200
the same £150 CAC may be difficult to sustain.
That is why:
cheap leads are not the goal.
Profitable customers are.
Use CAC to improve:
- marketing channels;
- lead handling;
- pricing;
- capacity planning;
- budgeting.
And always remember:
marketing should not be judged only by:
how much revenue it produces.
It should be judged by:
how much profitable customer value it creates after the cost of acquisition.