
A service business can generate a lot of revenue and still make almost no money.
Consider two companies.
Company A
Monthly revenue:
£40,000
Monthly profit:
£8,000
Company B
Monthly revenue:
£80,000
Monthly profit:
£2,000
Company B generates twice as much revenue.
But Company A is financially healthier.
That is why revenue alone does not tell you whether a service business is performing well.
One of the most useful numbers an owner can understand is:
break-even revenue.
Break-even revenue tells you approximately how much sales revenue your business needs before it has covered its operating costs.
A basic model looks like:
Revenue
↓
Direct Job Costs
↓
↓
Overhead
↓
Operating Profit
At break-even:
Operating Profit = £0
You have covered your costs, but you have not yet generated meaningful profit.
Once you understand this number, you can make better decisions about:
- pricing;
- technician targets;
- marketing budgets;
- hiring;
- equipment purchases;
- expansion.
What Is the Break-Even Point?
The break-even point is where:
Total Revenue = Total Costs
At that point, the business is neither making nor losing money under the assumptions used in the calculation.
If monthly break-even revenue is:
£50,000
then:
£40,000 Revenue
You may be operating below break-even.
£50,000 Revenue
Approximately break-even.
£65,000 Revenue
You are operating above break-even.
The exact profit still depends on:
- margins;
- additional expenses;
- financial structure.
But the number gives management a useful target.
Break-Even Revenue Is Different From Cash Flow
This is important.
Break-even analysis is primarily about:
profitability.
Cash-flow forecasting is about:
timing of money entering and leaving the bank.
A company can be:
profitable
and still face a temporary cash shortage because customers have not paid yet.
Likewise, a company can have:
cash in the bank
while operating below break-even because the cash came from:
- loans;
- previous profits;
- owner investment.
You need both metrics.
Why Break-Even Revenue Matters
Without a break-even target, owners may manage by instinct.
They say:
We need to do about £60,000 this month.
Why?
Often there is no calculation behind it.
A break-even model lets you ask:
What do we actually need to sell to cover the business?
That turns revenue targets into something more meaningful.
The Basic Break-Even Revenue Formula
For many service businesses, a practical formula is:
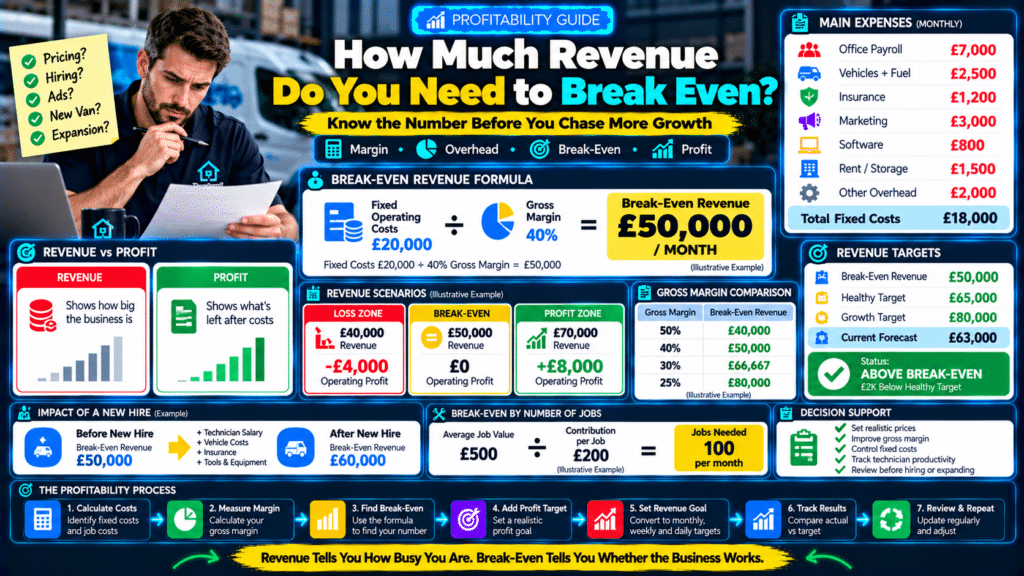
Break-Even Revenue = Fixed Operating Costs ÷ Gross Margin Percentage
For example:
Monthly fixed operating costs:
£20,000
Gross margin:
40%
Break-even revenue:
£20,000 ÷ 0.40 = £50,000
So the company needs approximately:
£50,000 monthly revenue
to generate:
£20,000 gross profit
which covers:
£20,000 fixed costs.
Why Gross Margin Is Used
Revenue itself does not pay overhead.
The portion remaining after direct job costs does.
Suppose a job sells for:
£1,000
and direct costs are:
£600.
Gross profit:
£400
Gross margin:
40%.
That £400 contributes toward:
- office salaries;
- rent;
- software;
- marketing;
- insurance;
- management;
- profit.
This is why break-even revenue depends heavily on gross margin.
Gross Margin Formula
Use:
Gross Profit ÷ Revenue × 100
Example:
Revenue:
£100,000
Direct job costs:
£60,000
Gross profit:
£40,000
Gross margin:
40%.
Gross Margin vs Markup
Do not confuse margin with markup.
If something costs:
£600
and sells for:
£1,000
profit:
£400
Markup on cost:
£400 ÷ £600 = 66.7%
Gross margin:
£400 ÷ £1,000 = 40%
They are different.
For break-even calculations, the margin percentage is typically the more useful figure.
Step 1: Identify Fixed Operating Costs
Fixed costs are expenses that do not change directly with every individual job.
Examples may include:
- office salaries;
- management wages;
- rent;
- insurance;
- software;
- phones;
- accounting;
- marketing retainers;
- vehicle finance;
- warehouse;
- administrative expenses.
The exact classification depends on your accounting structure.
The goal is consistency.
Example Monthly Fixed Costs
| Expense | Monthly Cost |
|---|---|
| Office Payroll | £7,000 |
| Rent / Storage | £1,500 |
| Vehicle Fixed Costs | £2,500 |
| Insurance | £1,200 |
| Software | £800 |
| Marketing | £3,000 |
| Phones / Internet | £500 |
| Accounting / Admin | £700 |
| Other Overhead | £800 |
Total:
£18,000
This becomes the starting point.
Step 2: Identify Direct Job Costs
Direct costs usually increase as more work is completed.
Examples include:
- field labor;
- materials;
- subcontractors;
- job-specific equipment;
- disposal;
- commissions tied directly to sales.
Suppose:
Monthly revenue:
£60,000
Direct costs:
£36,000
Gross profit:
£24,000
Gross margin:
40%.
Step 3: Calculate Break-Even Revenue
Use:
Fixed Costs ÷ Gross Margin
Fixed operating costs:
£18,000
Gross margin:
40%
Break-even:
£18,000 ÷ 0.40
=
£45,000 per month
That means around:
£45,000 revenue
is needed to cover the fixed-cost structure under those assumptions.
Step 4: Add a Profit Target
Break-even should not be your long-term goal.
A business that only breaks even has little room for:
- unexpected costs;
- equipment replacement;
- owner return;
- growth;
- mistakes.
Once you know break-even, add a target profit.
Suppose:
Fixed costs:
£18,000
Desired operating profit:
£6,000
Required gross profit:
£24,000
At 40% gross margin:
£24,000 ÷ 0.40
=
£60,000 revenue
Now the business has two useful targets:
Break-Even Revenue: £45,000
Target Revenue: £60,000
Much more useful than saying:
Let’s try to do £60K.
Break-Even Example for a Plumbing Business
Suppose a plumbing company has:
Monthly fixed overhead:
£25,000
Average gross margin:
45%
Break-even revenue:
£25,000 ÷ 0.45
=
approximately:
£55,556
If the business wants:
£10,000 operating profit
then required gross profit becomes:
£35,000
Revenue target:
£35,000 ÷ 0.45
=
approximately:
£77,778
Now the owner knows:
Below ~£55.6K
Likely below operating break-even.
Around £55.6K
Approximately break-even.
Around £77.8K
Potentially supports the targeted £10K operating profit.
Break-Even Example for an Electrical Contractor
Fixed monthly costs:
£30,000
Gross margin:
35%
Break-even revenue:
£30,000 ÷ 0.35
=
approximately:
£85,714
This company needs much more revenue than the plumbing example because its gross margin is lower.
That demonstrates an important principle:
lower gross margins create higher break-even revenue.
Why Margin Has Such a Big Impact
Suppose fixed costs are:
£20,000
At 50% Gross Margin
Break-even:
£40,000
At 40% Gross Margin
Break-even:
£50,000
At 30% Gross Margin
Break-even:
£66,667
At 25% Gross Margin
Break-even:
£80,000
Same overhead.
Very different revenue requirement.
This is why improving margin can sometimes be more powerful than simply chasing more sales.
Revenue Growth Without Margin Can Be Dangerous
Suppose a company increases monthly revenue from:
£60,000
to:
£90,000.
Sounds excellent.
But gross margin drops from:
40%
to:
25%.
Before
£60,000 × 40% =
£24,000 gross profit
After
£90,000 × 25% =
£22,500 gross profit
The business generated:
£30,000 more revenue
but less gross profit.
This is why:
revenue without margin can be misleading.
Track Gross Profit, Not Only Revenue
Owner dashboard should not only show:
Revenue: £80,000
Also show:
Gross Profit: £32,000
Gross Margin: 40%
Overhead: £24,000
Operating Profit: £8,000
Now management sees the full picture.
What Counts as Overhead?
Overhead generally includes costs required to operate the business that cannot easily be attributed to one specific job.
Examples:
- management;
- administration;
- office;
- insurance;
- software;
- general marketing.
But expense classification varies.
Work with your bookkeeper or accountant so job costing and financial reports use consistent categories.
The most important thing is:
do not change definitions every month.
Owner Salary Can Affect Break-Even
This is often mishandled.
Imagine the owner works:
60 hours per week
inside the business but pays themselves almost nothing.
The company appears profitable.
But if another person had to replace the owner’s work, the business might become unprofitable.
Include realistic compensation for owner roles where appropriate.
Ask:
What would it cost the company to replace the work I currently perform?
This gives a clearer view of economic profitability.
Technician Wages: Direct Cost or Overhead?
It depends on how your accounting system is structured.
For many field-service businesses, technician labor directly associated with jobs is treated as:
direct cost.
Office and management wages may be treated as:
overhead.
The key is consistency.
If technician wages are already included in cost of goods sold or direct job costs:
do not count them again in fixed overhead.
Avoid double counting.
Materials Should Usually Be Included in Job Costs
If a job includes:
£500 parts
those materials affect gross profit.
Selling price:
£1,500
Direct labor:
£400
Materials:
£500
Other direct cost:
£100
Total direct cost:
£1,000
Gross profit:
£500
Gross margin:
33.3%.
That margin helps determine break-even.
Variable Marketing Costs
Marketing can be complicated.
A fixed:
£2,000 SEO retainer
may behave like fixed overhead.
A commission paid only when a job sells may behave more like a variable cost.
Google Ads spend can also scale with growth.
You can choose a consistent treatment based on your financial model.
The key is not mathematical perfection.
It is building a useful management model.
Calculate Annual Break-Even Revenue
If monthly fixed costs are stable, you can estimate annual break-even.
Example:
Monthly overhead:
£25,000
Annual:
£300,000
Gross margin:
40%
Annual break-even:
£300,000 ÷ 0.40
=
£750,000 annual revenue
This helps with annual planning.
But still track monthly or weekly performance because seasonality matters.
Break-Even Can Change by Season
An HVAC business may experience:
- summer peak;
- winter peak;
- shoulder-season slowdown.
A landscaping company may have:
- strong spring/summer;
- weak winter.
Break-even costs may remain relatively stable even when revenue changes.
This is why strong seasons often need to help support slower periods.
Monthly Break-Even Is Not Always Identical
Some months contain:
- annual insurance;
- bonuses;
- software renewals;
- equipment maintenance.
For planning, you may use:
average monthly overhead
or calculate actual monthly cost.
Use whichever gives management the most useful picture.
Convert Break-Even Revenue Into Weekly Revenue
Suppose monthly break-even is:
£60,000.
Approximate weekly target:
£60,000 × 12 ÷ 52
=
approximately:
£13,846 per week
This can make performance easier to monitor.
Convert Break-Even Into Daily Revenue
Suppose you operate:
5 days per week
and weekly target is:
£13,846.
Daily average:
about £2,769.
Now operations can compare:
daily booked revenue
with:
required production.
Use this carefully because not every day needs to produce exactly the same amount.
Break-Even Per Technician
You can also convert company targets into technician-level targets.
Suppose:
Monthly revenue target:
£80,000
Field technicians:
4
If workload is evenly distributed:
£20,000 per technician per month
This is not a perfect metric.
Technicians may handle different services.
But it provides a starting point.
Revenue per Productive Hour
Suppose each technician produces:
120 productive hours per month.
Revenue requirement per technician:
£20,000
Revenue per productive hour:
£166.67
This helps connect:
- pricing;
- utilization;
- revenue targets.
If average revenue per productive hour is only:
£110
you may have a structural gap.
Do Not Solve Every Gap by Working Faster
If required revenue per hour is too high, possible causes include:
- prices too low;
- gross margin too low;
- overhead too high;
- technician utilization too low;
- service mix weak.
The answer is not always:
technicians need more jobs.
Analyze the system.
Break-Even by Service Type
Different services may produce very different margins.
Example:
Emergency Repairs
Revenue:
£20,000
Gross margin:
50%.
Gross profit:
£10,000.
Installations
Revenue:
£50,000.
Gross margin:
25%.
Gross profit:
£12,500.
Installations generate much more revenue.
But only slightly more gross profit.
This matters when deciding:
- what to market;
- what to grow.
Contribution Margin
Another useful concept is:
contribution margin.
It measures how much revenue remains after variable/direct costs to contribute toward fixed costs and profit.
If a £1,000 service has:
£600 variable costs
contribution:
£400
or:
40%.
For many simplified break-even models, this behaves similarly to the gross-margin percentage used earlier.
Break-Even in Number of Jobs
You can also calculate:
How many jobs do we need?
Suppose:
Average job value:
£500
Average contribution per job:
£200
Fixed costs:
£20,000
Jobs required:
£20,000 ÷ £200
=
100 jobs
This gives operations a concrete target.
But Average Job Values Can Hide Problems
Suppose average:
£500
but your jobs range from:
£80 service calls
to:
£10,000 installations.
Using one average may oversimplify.
For more accurate planning:
segment services.
Example Service Mix
Maintenance
80 jobs × £150 contribution =
£12,000
Repairs
40 jobs × £250 contribution =
£10,000
Installations
8 jobs × £1,000 contribution =
£8,000
Total contribution:
£30,000
If overhead is:
£24,000
operating profit:
£6,000
Service-mix planning can be more useful than one average job count.
Break-Even and Hiring
Before hiring another technician, calculate:
what happens to break-even?
Suppose new technician adds:
- vehicle;
- insurance;
- software;
- management cost.
Break-even revenue may increase.
That is not necessarily bad.
The technician should also add capacity.
But the owner should understand:
new hire = new revenue requirement.
Example
Current fixed cost:
£20,000
Gross margin:
40%
Break-even:
£50,000
New technician-related fixed overhead:
£4,000
New fixed costs:
£24,000
New break-even:
£60,000
The business now needs:
£10,000 more monthly revenue
to cover the expanded structure.
Can the new technician generate enough contribution?
That is the decision.
Break-Even and Marketing
Imagine increasing advertising by:
£3,000/month.
If treated as additional fixed spending:
old overhead:
£20,000
new overhead:
£23,000
At 40% gross margin:
new break-even:
£57,500
The campaign needs to generate enough additional gross profit to justify the cost.
Do not evaluate marketing only by:
leads.
Evaluate:
incremental gross profit.
Break-Even and New Vehicles
Buying another van affects more than the payment.
Possible expenses include:
- finance;
- insurance;
- fuel;
- maintenance;
- branding;
- equipment.
Add those costs to your model.
Then ask:
How much additional revenue does this capacity need to generate?
This makes expansion more deliberate.
Break-Even and Pricing
Suppose overhead stays:
£20,000
but improved pricing raises gross margin from:
35%
to:
42%.
Before
Break-even:
£20,000 ÷ 0.35 =
£57,143
After
£20,000 ÷ 0.42 =
£47,619
Break-even drops by nearly:
£9,524 per month.
Small margin improvements can have large effects.
Break-Even and Overhead Reduction
Suppose margin is:
40%.
Overhead drops from:
£25,000
to:
£22,000.
Break-even changes from:
£62,500
to:
£55,000.
That is:
£7,500 less revenue
required each month to cover costs.
Cost control matters.
But Do Not Cut Useful Expenses Blindly
Not every expense should be reduced.
Cutting:
- technician training;
- effective marketing;
- useful software
may reduce costs but damage:
- quality;
- sales;
- productivity.
The goal is not:
lowest possible overhead.
It is:
productive overhead.
Create Three Revenue Targets
Instead of one target, create three.
1. Survival / Break-Even
Example:
£50,000
2. Healthy Target
Example:
£65,000
3. Growth Target
Example:
£80,000
This makes performance easier to interpret.
Example Dashboard
Monthly Break-Even: £52K
Healthy Target: £68K
Growth Target: £80K
Current Forecast: £63K
Status:
Above Break-Even — Below Target
That tells management much more than:
Revenue is £63K.
Track Break-Even Coverage
A useful metric is:
Actual Revenue ÷ Break-Even Revenue
Example:
Actual revenue:
£75,000
Break-even:
£60,000
Coverage:
1.25x
Or:
125% of break-even.
This helps you see how much room the business has above minimum operating needs.
Do Not Use One Month in Isolation
One unusually strong or weak month can be misleading.
Track:
- month;
- quarter;
- rolling 12 months.
This helps account for seasonality.
Use Forecast Revenue Too
Break-even analysis should not only look backward.
Suppose:
Next month’s scheduled revenue:
£42,000
Expected additional sales:
£10,000
Total forecast:
£52,000
Break-even:
£60,000
Gap:
£8,000
Now sales and operations know what needs attention.
Build a Break-Even Gap Report
Example:
Break-Even Revenue: £60,000
Forecast Revenue: £52,000
Gap: £8,000
Possible response:
- increase quote follow-up;
- fill schedule gaps;
- improve marketing;
- move available work forward.
You can act before the month ends.
Break-Even Is a Management Tool, Not a Guarantee
The calculation depends on assumptions.
If:
- gross margin changes;
- overhead changes;
- job mix changes;
break-even changes.
Update it regularly.
Do not calculate it once and leave it unchanged for five years.
Review Break-Even Quarterly
A good cadence may be:
monthly monitoring
with:
quarterly full recalculation.
Also recalculate after:
- major hire;
- vehicle purchase;
- office expansion;
- price change;
- major new marketing spend.
Break-Even Spreadsheet Structure
A simple model can include:
Fixed Costs
Office payroll
Rent
Insurance
Software
Marketing
Vehicles
Other
Financial Metrics
Revenue
Direct costs
Gross profit
Gross margin
Outputs
Break-even revenue
Target profit
Target revenue
Revenue gap
That is enough to start.
Common Break-Even Mistakes
Using Revenue Instead of Margin
You need to account for direct job costs.
Mixing Markup and Margin
They are not the same.
Forgetting Owner Compensation
Can make profits look artificially high.
Double Counting Technician Labor
Do not include the same expense twice.
Using Unrealistic Gross Margin
Use real historical numbers.
Ignoring Seasonality
One monthly average may not tell the full story.
Never Updating Overhead
Costs change.
Treating Break-Even as the Goal
A business needs profit above break-even.
Ignoring Service Mix
Different services have different margins.
Using Break-Even Instead of Cash Forecasting
Both are needed.
Break-Even Checklist
Review:
- Monthly fixed costs identified
- Direct job costs defined
- Gross margin calculated
- Break-even revenue calculated
- Profit target added
- Target revenue calculated
- Revenue target converted weekly
- Technician capacity checked
- Service mix reviewed
- Hiring impact modeled
- Marketing impact modeled
- Break-even updated regularly
- Cash flow reviewed separately
Sources and Further Reading
These official resources back up the methods in this guide and are worth reading alongside it.
- Break-even point (U.S. Small Business Administration): the fixed costs ÷ contribution margin formula and a free break-even calculator.
- Write your business plan (U.S. Small Business Administration): building financial projections and pricing plans.
- Manage your finances (U.S. Small Business Administration): bookkeeping, financial statements and cash versus accrual accounting.
Related guides
- How to Calculate Gross Profit Per Job in a Service Business
- Revenue vs Profit vs Cash Flow: What Service Business Owners Need to Know
- How to Improve Gross Margin in a Service Business Without Just Raising Prices
- Tools, Software and Automation for Trades: Start Here
Frequently Asked Questions
What is break-even revenue?
Break-even revenue is the amount of revenue required to cover your costs under the assumptions used in your financial model.
At break-even, operating profit is approximately zero.
How do I calculate break-even revenue?
A common simplified formula is:
Fixed Costs ÷ Gross Margin Percentage
Example:
£20,000 fixed costs ÷ 40% margin =
£50,000 break-even revenue.
What is the difference between break-even revenue and profit?
Break-even means the business has approximately covered its costs.
Profit begins once revenue and gross profit exceed the amount required to cover those costs.
Is gross margin the same as markup?
No.
Gross margin compares profit with selling price.
Markup compares profit with cost.
Should technician wages be included?
If technician wages are treated as direct job costs in your accounting model, they should be reflected in gross margin rather than counted again in overhead.
How often should I calculate break-even?
Review it regularly and recalculate when major expenses, margins, staffing, or pricing change.
Does break-even include tax?
It depends on the financial model being used.
Break-even analysis should be built consistently with your accountant or financial reports.
Can a company be above break-even and still have no cash?
Yes.
Profitability and cash flow are different.
Customers may not have paid invoices yet.
Can increasing prices reduce break-even revenue?
If higher pricing improves gross margin without causing other major changes, break-even revenue can decrease.
Should I calculate break-even before hiring?
Yes.
Hiring increases costs and often raises the amount of revenue required to support the business.
Conclusion
Learning how to calculate break-even revenue gives a service-business owner a much clearer answer to:
How much revenue do we actually need?
Do not manage the business only by saying:
We had a good month.
Calculate:
Fixed Costs
↓
Gross Margin
↓
Break-Even Revenue
↓
Profit Target
↓
Target Revenue
For example:
£20,000 fixed costs
at:
40% gross margin
creates approximately:
£50,000 break-even revenue.
If you want:
£8,000 operating profit
required gross profit becomes:
£28,000
and target revenue becomes:
£70,000.
Now you know the difference between:
surviving
and:
hitting your financial target.
Break-even analysis also helps answer bigger decisions:
Can we afford another technician?
Can we increase marketing spend?
Can we add another van?
Are our prices high enough?
Is our gross margin healthy enough?
The goal is not to obsess over one formula.
It is to understand how:
pricing
margin
overhead
capacity
revenue
fit together.
Revenue tells you how big the business is.
Margin tells you how much of that revenue remains.
Break-even tells you how much revenue the business needs before it truly starts creating profit.



1 thought on “How to Calculate Break-Even Revenue for a Service Business”
Pingback: How to Build a Monthly Budget for a Service Business