
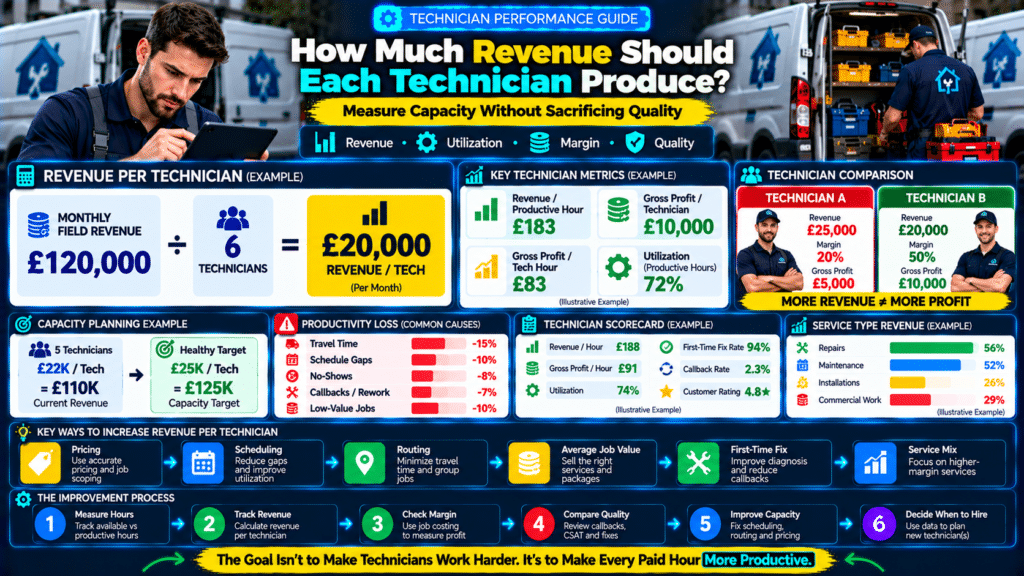
A service business can know its total monthly revenue and still have very little understanding of how effectively its field team is being used.
Suppose your company generates:
£120,000 per month
with:
6 technicians.
Is that good?
The answer depends on:
- technician hours;
- job mix;
- pricing;
- travel;
- callbacks;
- gross margin;
- service type.
One useful starting metric is:
revenue per technician.
At its simplest:
Total Field Revenue ÷ Number of Technicians = Revenue Per Technician
Using the example above:
£120,000 ÷ 6 = £20,000 per technician per month
But that number becomes much more valuable when you connect it with:
- productive hours;
- revenue per technician hour;
- gross profit;
- utilization;
- first-time fix rate.
The goal is not to create a scoreboard that pressures technicians.
The goal is to understand whether the business is using its field capacity effectively.
A strong technician-performance view looks like:
Available Hours
↓
Productive Hours
↓
Jobs Completed
↓
Revenue Produced
↓
Gross Profit Produced
↓
Quality
↓
Customer Outcomes
Revenue per technician is one piece of that system.
What Is Revenue per Technician?
Revenue per technician measures how much service revenue is generated relative to the number of field technicians in the business.
Basic formula:
Total Revenue Generated by Field Work ÷ Number of Technicians
Example:
Monthly field-service revenue:
£150,000
Technicians:
5
Revenue per technician:
£30,000/month
This can help you compare:
- months;
- teams;
- branches;
- growth stages.
Why Revenue per Technician Matters
Your field team is one of the largest cost and capacity drivers in many service businesses.
Each technician may require:
- wages;
- vehicle;
- fuel;
- tools;
- software;
- insurance;
- management support.
If technicians are producing too little revenue relative to that cost, the business may struggle to cover:
- overhead;
- profit targets.
Revenue per technician can reveal:
- weak scheduling;
- low utilization;
- low pricing;
- poor job mix;
- excessive travel.
Revenue per Technician Is Not the Same as Technician Profit
This distinction matters.
Suppose a technician generates:
£25,000 revenue
but their jobs have:
20% gross margin.
Another technician generates:
£20,000 revenue
at:
50% gross margin.
Technician A
Revenue:
£25,000
Gross profit:
£5,000
Technician B
Revenue:
£20,000
Gross profit:
£10,000
Technician B produces less revenue but twice as much gross profit.
That is why revenue per technician should never be used alone.
Step 1: Decide Which Revenue to Include
Use revenue directly related to field work.
Depending on your business, that may include:
- service jobs;
- repairs;
- installations;
- maintenance;
- approved additional work.
Be consistent.
If your company has:
- online product sales;
- unrelated consulting;
- office-generated revenue;
do not automatically divide all revenue by technician count.
Use a definition that reflects field production.
Step 2: Decide Which Technicians to Include
Do not automatically count every employee.
Revenue per technician normally focuses on:
- field technicians;
- installers;
- service engineers.
You may exclude:
- office staff;
- dispatchers;
- managers;
- salespeople.
Again, consistency matters.
Step 3: Calculate Basic Revenue per Technician
Formula:
Field Revenue ÷ Number of Technicians
Example:
Revenue:
£180,000/month
Technicians:
9
Revenue per technician:
£20,000/month
That becomes your starting metric.
Step 4: Adjust for Part-Time Technicians
Simple headcount can become misleading.
Suppose:
Technician A:
40 hours/week.
Technician B:
20 hours/week.
Counting both as:
2 full technicians
understates productivity.
Use:
full-time equivalents, or FTEs.
Example
Technician A:
1.0 FTE
Technician B:
0.5 FTE
Total:
1.5 FTE
Field revenue:
£30,000
Revenue per FTE technician:
£30,000 ÷ 1.5 = £20,000
That is more accurate.
Step 5: Calculate Revenue per Technician Hour
This is often more useful than revenue per technician alone.
Formula:
Technician Revenue ÷ Productive Technician Hours
Example:
Technician monthly revenue:
£22,000
Productive hours:
120
Revenue per productive hour:
£183.33
This helps compare jobs and teams more fairly.
Why Productive Hours Matter
Two technicians may both generate:
£20,000/month.
But:
Technician A
100 productive hours.
Revenue per hour:
£200
Technician B
140 productive hours.
Revenue per hour:
£142.86
Same monthly revenue.
Very different productivity.
Available Hours vs Productive Hours
A technician may be paid for:
173 hours/month
but only have:
120 productive hours.
The rest may include:
- travel;
- training;
- meetings;
- gaps;
- admin.
That is normal to some extent.
But it should be measured.
Revenue per Available Hour
You can also calculate:
Revenue ÷ Paid / Available Hours
Example:
Revenue:
£22,000
Available hours:
173
Revenue per available hour:
£127.17
This provides another useful view.
Productive-Hour Revenue vs Available-Hour Revenue
Revenue per Productive Hour
Measures performance during actual productive field time.
Revenue per Available Hour
Measures how well total paid technician capacity is being monetized.
The gap between the two often reflects:
- utilization.
Example
Revenue:
£24,000
Productive hours:
120
Available hours:
160
Revenue per Productive Hour
£24,000 ÷ 120 =
£200
Revenue per Available Hour
£24,000 ÷ 160 =
£150
The technician may be productive on jobs.
But the business may still have scheduling or utilization losses.
Step 6: Connect Revenue With Technician Utilization
Suppose utilization is:
60%.
You may improve revenue per technician without changing:
- pricing;
- technician speed.
Simply by reducing:
- gaps;
- travel;
- no-shows.
If utilization rises to:
72%
the same team has more productive capacity.
This is why revenue per technician and utilization should be reviewed together.
Step 7: Track Average Job Value
Revenue per technician is heavily influenced by average job value.
Formula:
Total Revenue ÷ Jobs Completed
Example:
Technician revenue:
£20,000
Jobs:
50
Average job value:
£400
If average job value increases to:
£460
with the same 50 jobs:
Revenue becomes:
£23,000
Revenue per technician rises without adding more appointments.
Improve Average Job Value Carefully
Do not push unnecessary work.
Legitimate improvements may come from:
- correct pricing;
- better service packages;
- approved additional work;
- maintenance plans.
The goal is:
more customer value
not:
aggressive upselling.
Step 8: Track Jobs Completed
Revenue per technician without job count lacks context.
Example:
Technician A
Revenue:
£20,000
Jobs:
20
Average job:
£1,000
Technician B
Revenue:
£20,000
Jobs:
80
Average job:
£250
Both generate the same revenue.
But their work mix is completely different.
Do Not Compare Different Job Types Blindly
An installation technician may complete:
8 jobs/month
while a repair technician completes:
70.
Raw job count tells you almost nothing across different service types.
Use context.
Step 9: Connect Revenue to Gross Profit
Revenue per technician becomes much stronger when paired with:
gross profit per technician.
Formula:
Gross Profit From Technician Jobs ÷ Technician
Example:
Revenue:
£25,000
Direct job costs:
£15,000
Gross profit:
£10,000
Technician gross margin:
40%.
That is more meaningful than revenue alone.
Calculate Gross Profit per Technician Hour
Formula:
Gross Profit ÷ Productive Technician Hours
Example:
Gross profit:
£10,000
Productive hours:
120
Gross profit per tech hour:
£83.33
This helps identify the economic value of field capacity.
Compare Two Technicians
Technician A
Revenue:
£28K
Gross profit:
£8K
Productive hours:
130
Gross profit/hour:
£61.54
Technician B
Revenue:
£23K
Gross profit:
£11K
Productive hours:
115
Gross profit/hour:
£95.65
Technician B may be creating much more useful financial value.
Step 10: Track Revenue per Technician by Service Type
Different services behave differently.
Example:
Repairs
Revenue per technician:
£24K/month
Gross margin:
52%
Installations
Revenue per technician:
£40K/month
Gross margin:
26%
Installations produce more revenue.
Repairs produce better margins.
Both may be valuable.
You need both sides.
Step 11: Track Revenue per Technician by Territory
Geography can significantly affect results.
Zone A
Average travel:
15 minutes.
Revenue per technician:
£26K
Zone B
Average travel:
40 minutes.
Revenue per technician:
£19K
The issue may not be technician performance.
It may be territory design.
Step 12: Track Revenue per Technician by Lead Source
This can reveal marketing quality.
Example:
Technician jobs from Google Ads:
Average job value:
£420
Referral jobs:
£620
Organic jobs:
£510
If one channel consistently creates:
- better jobs;
- stronger margins;
it may deserve more investment.
Step 13: Set a Technician Revenue Target
Targets should come from business economics.
Do not simply choose:
£20,000/month
because it sounds good.
Start with:
- technician true cost;
- overhead;
- margin target;
- profit target.
Example
Technician-related monthly cost:
£5,000
Company gross margin target:
40%
If the technician needs to contribute:
£10,000 gross profit
to cover their cost and wider overhead:
Required revenue:
£10,000 ÷ 0.40
=
£25,000/month
This gives you a financially grounded target.
Revenue Target per Productive Hour
Suppose monthly target:
£25,000
Expected productive hours:
125
Required revenue per productive hour:
£200
Now pricing and scheduling can be tested against that target.
Example
If current revenue per productive hour is:
£155
but target is:
£200
you have a gap.
Possible causes:
- pricing too low;
- job mix too weak;
- too many small jobs.
Do not simply tell the technician:
work faster.
Investigate the system.
Revenue Target vs Break-Even Revenue
Suppose company break-even revenue is:
£100,000/month
with:
5 technicians.
A rough equal allocation would be:
£20,000 per technician
just to support break-even.
If target profit requires:
£125,000 revenue
then:
£25,000 per technician
may be the healthier operating target.
This is simplified, but useful for capacity planning.
Step 14: Include Capacity Before Hiring
Before adding another technician, ask:
Are existing technicians already near a healthy utilization level?
Suppose:
5 technicians.
Revenue:
£100,000
Revenue per tech:
£20,000
But utilization is only:
58%.
Maybe you do not need technician #6 yet.
You may need:
- better scheduling;
- more demand;
- better routing.
New Hire Example
Current:
5 techs × £22K:
£110K revenue
Add technician #6.
If revenue stays:
£110K
Revenue per technician falls to:
£18.3K
until the new capacity is filled.
That is normal during ramp-up.
But the business should forecast it.
Hiring Should Follow Demand and Economics
New technician capacity should be justified by:
- sufficient lead volume;
- existing scheduling pressure;
- financial capacity.
Hiring too early creates:
idle payroll.
Hiring too late creates:
lost jobs and burnout.
Revenue-per-technician data can help find the balance.
Step 15: Track Technician Ramp-Up
A new hire should not be expected to hit full revenue immediately.
Example ramp plan:
Month 1
Target:
50%
Month 2
70%
Month 3
85%
Month 4+
100% target
The exact timeline depends on:
- trade complexity;
- experience;
- onboarding.
Step 16: Do Not Reward Revenue Alone
A technician could increase revenue by:
- overselling;
- rushing;
- ignoring quality.
That is dangerous.
Use a balanced scorecard.
Balanced Technician Scorecard
Possible metrics:
Revenue / Productive Hour
Gross Profit / Hour
Utilization
First-Time Fix Rate
Callback Rate
Customer Rating
Documentation Quality
This gives a much fairer view.
Example Scorecard
Revenue / Productive Hour: £188
Gross Profit / Hour: £91
Utilization: 74%
First-Time Fix: 94%
Callback Rate: 2.3%
Customer Rating: 4.8★
That is much stronger than:
Technician did £25K this month.
Step 17: Protect Quality
Revenue targets should never encourage:
- shortcuts;
- unnecessary repairs;
- unsafe work.
Technicians should be rewarded for:
good profitable work
not simply:
maximum invoices.
Step 18: Track Callback Cost
If a technician generates:
£25K revenue
but creates:
£2K of callback cost
their true economic contribution is lower.
Callbacks consume:
- labor;
- fuel;
- parts.
Link callbacks to original work where possible.
Step 19: Track Discounts
Technician A generates:
£24K revenue
with:
£3K discounts.
Technician B:
£23K revenue
with:
£500 discounts.
The second may be protecting pricing better.
Track discount patterns.
Step 20: Track Quote Conversion Where Technicians Sell
If technicians present estimates:
track:
Quotes Presented
Quotes Accepted
Average Ticket
But never reward conversion in a way that encourages unnecessary work.
Step 21: Understand Revenue Capacity
Revenue per technician can help forecast company capacity.
Example:
Healthy technician target:
£25K/month
Technicians:
8
Potential monthly field revenue:
£200K
This is a rough capacity model.
Actual revenue depends on:
- demand;
- job mix;
- utilization.
Capacity Planning Example
Current technicians:
6
Average healthy production:
£24K
Current capacity:
£144K/month
Forecast demand:
£175K/month
Capacity gap:
£31K
This may justify:
- overtime temporarily;
- better utilization;
- another technician.
Step 22: Compare Revenue Capacity With Demand
Having technicians does not create demand.
Suppose team capacity:
£180K/month
but sales pipeline only supports:
£130K.
The business has too much field capacity.
That may cause:
- low utilization;
- weak revenue per technician.
Marketing and operations must be aligned.
Step 23: Use Revenue per Technician for Branch Comparison
If you operate multiple locations:
Branch A
Revenue per tech:
£27K
Branch B
£19K
Do not assume Branch B technicians are weaker.
Review:
- market demand;
- travel;
- pricing;
- service mix.
The metric starts the question.
It does not finish the analysis.
Step 24: Track Trends Over Time
Example:
January
£18K per technician
February
£20K
March
£22K
April
£24K
This shows improvement.
But also check:
- gross margin;
- quality.
If revenue rises while callback rate doubles:
the improvement may be unhealthy.
Step 25: Adjust for Seasonality
HVAC technicians may generate more revenue during:
- extreme summer;
- extreme winter.
Landscaping may peak:
- spring;
- summer.
Do not compare:
January
with:
July
without context.
Use:
- same month last year;
- seasonal targets.
Step 26: Track Weekly Revenue per Technician
Monthly reporting is useful.
Weekly reporting catches changes earlier.
Example:
Technician weekly target:
£5,500
Current:
£4,100
Why?
Could be:
- no-shows;
- slow week;
- vehicle downtime;
- low demand.
Investigate before month-end.
Step 27: Use Rolling Averages
One week can be unusual.
Use:
4-week rolling average
to smooth:
- holidays;
- sick days;
- large jobs.
This gives a more stable performance view.
Step 28: Include Working Days
Technician on leave for:
one week
should not be compared against someone who worked all month.
Use:
revenue per working day
or:
revenue per productive hour.
This improves fairness.
Revenue per Working Day
Formula:
Technician Revenue ÷ Days Worked
Example:
Revenue:
£22,000
Days worked:
20
Revenue per working day:
£1,100
Useful for short-term tracking.
Step 29: Measure Revenue per Van
If each technician typically uses a dedicated van, you can also track:
Revenue per Vehicle
This helps assess vehicle economics.
Example:
Van cost:
£1,200/month
Revenue supported:
£25,000/month
That may be acceptable.
But if a van supports only:
£8,000
something deserves review.
Step 30: Calculate Technician Contribution After Direct Costs
A deeper metric:
Technician Revenue
minus:
Direct Job Costs
=
Gross Profit Contribution
This is often more useful for profitability analysis.
Example:
Revenue:
£26K
Direct costs:
£15K
Gross profit:
£11K
Then compare against:
- technician-related fixed costs;
- overhead.
Revenue per Technician vs Revenue per Employee
These are different.
Revenue per Technician
Field productivity.
Revenue per Employee
Overall company efficiency.
A business may have high technician revenue but too much office overhead.
Both can be useful.
Example
Revenue:
£200K
8 technicians.
Revenue per technician:
£25K
Total employees:
Revenue per employee:
£14.3K
This reveals the cost of wider organizational structure.
Do Not Automatically Cut Office Staff
Lower revenue per employee does not mean office roles are unnecessary.
Good dispatch and admin can actually improve technician production.
The metric should support analysis, not simplistic cuts.
Revenue per Technician and Gross Margin
Revenue target should reflect margin.
Example:
Company A
Technician revenue:
£30K
Margin:
25%
Gross profit:
£7.5K
Company B
Technician revenue:
£24K
Margin:
45%
Gross profit:
£10.8K
Company B extracts more value from each technician.
Revenue per Technician Improvement Strategies
If the number is too low, investigate:
Pricing
Are jobs priced correctly?
Utilization
Are technicians spending too much time idle?
Travel
Are routes inefficient?
Job Mix
Are too many low-value jobs booked?
Average Ticket
Are legitimate additional needs being missed?
Callbacks
Is paid capacity being wasted on rework?
No-Shows
Are schedule slots disappearing?
Demand
Is there enough work?
Fix the correct problem.
Example Improvement
Technician currently generates:
£18K/month
Through:
- better scheduling;
- fewer no-shows;
- stronger pricing;
revenue rises to:
£22K
Same technician.
Same van.
Increase:
£4K/month
Across five technicians:
£20K more monthly revenue capacity.
If margins remain healthy, the impact can be substantial.
Revenue per Technician Dashboard
Track:
Revenue / Technician
Revenue / Productive Hour
Gross Profit / Technician
Gross Profit / Tech Hour
Utilization
Average Job Value
First-Time Fix
Callback Rate
Customer Rating
That provides a complete picture.
Revenue per Technician Checklist
Review whether you are tracking:
- Field revenue
- Technician headcount / FTE
- Revenue per technician
- Productive hours
- Revenue per productive hour
- Available hours
- Utilization
- Average job value
- Jobs completed
- Gross profit per technician
- Gross profit per tech hour
- Callback rate
- First-time fix rate
- Territory differences
- Service-mix differences
Sources and Further Reading
These official resources back up the methods in this guide and are worth reading alongside it.
- Manage your finances (U.S. Small Business Administration): bookkeeping, financial statements and cash flow basics.
- Write your business plan (U.S. Small Business Administration): building financial projections.
Related guides
- How to Improve Technician Utilization in a Service Business: Practical Guide
- How to Set Customer Expectations Before a Service Job: 12 Practical Steps
- Tools, Software and Automation for Trades: Start Here
Frequently Asked Questions
How do you calculate revenue per technician?
Use:
Field Revenue ÷ Number of Technicians
Example:
£120,000 revenue ÷ 6 technicians =
£20,000 per technician.
Should part-time technicians count as full technicians?
For more accurate reporting, use:
full-time equivalents
or track revenue per hour.
What is revenue per technician hour?
It is:
Technician Revenue ÷ Technician Hours
You can calculate it using:
- productive hours;
- available hours,
depending on what you want to measure.
What is a good revenue per technician?
There is no universal number.
It depends on:
- trade;
- pricing;
- job mix;
- geography;
- margins.
Compare against your own costs and profit targets.
Should technicians have revenue targets?
They can, but targets should be realistic and paired with quality metrics.
Avoid revenue-only incentives.
Is revenue per technician the same as profit?
No.
A technician can produce high revenue but poor gross margin.
Track gross profit too.
Should callbacks reduce technician performance?
Callback cost should be considered when evaluating quality and economic contribution.
Does travel affect revenue per technician?
Yes.
More travel reduces the time available for customer work.
Can revenue per technician help with hiring?
Yes.
It can help show whether the current team has unused capacity or whether demand is exceeding healthy production levels.
Should I compare technicians directly?
Use caution.
Differences in:
- territory;
- job type;
- experience
can make direct comparisons unfair.
Conclusion
Learning how to calculate revenue per technician gives a service-business owner a clearer view of field capacity.
Start with:
Field Revenue ÷ Technician Count
But do not stop there.
Add:
Revenue Per Productive Hour
↓
Gross Profit Per Technician
↓
Gross Profit Per Technician Hour
↓
Utilization
↓
Quality
For example:
A technician producing:
£25,000 revenue
at:
25% margin
may be less valuable financially than one producing:
£22,000
at:
50% margin.
Revenue is only one part of the story.
Use technician metrics to answer:
Are we priced correctly?
Are we scheduling efficiently?
Do we have enough work?
Do we actually need another technician?
The goal is not:
make technicians work harder.
It is:
make better use of the capacity you already pay for.
The strongest field-service businesses balance:
Revenue
Margin
Utilization
Quality
When all four are healthy, technician capacity becomes much easier to scale profitably.



1 thought on “How to Calculate Revenue per Technician in a Service Business”
Pingback: Flat Rate vs Time and Materials: Which Pays Better?