
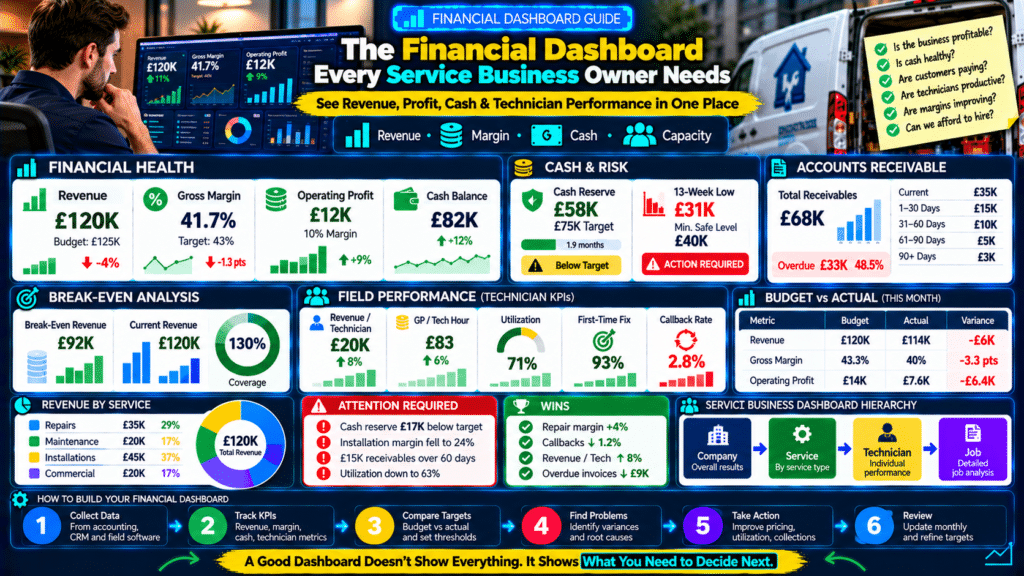
A service-business owner should not need to open:
- five spreadsheets;
- three software platforms;
- an accounting report;
- a bank account;
just to answer:
“How is the business doing?”
A good financial dashboard brings the most important numbers into one place.
It should help answer questions such as:
Are we profitable?
Is cash healthy?
Are customers paying us?
Are technicians producing enough value?
Are margins improving or getting worse?
Can we afford to hire?
A useful financial dashboard for a service business connects:
Revenue
↓
↓
Operating Profit
↓
Cash
↓
Accounts Receivable
↓
Break-Even
↓
Technician Performance
↓
Forecast
The goal is not to track every number in the business.
The goal is to see the few numbers that help you make better decisions.
What Is a Financial Dashboard?
A financial dashboard is a visual summary of key business metrics.
It can be built in:
- spreadsheet software;
- accounting software;
- field service software;
- business intelligence tools.
A good dashboard turns raw data into:
- KPIs;
- trends;
- alerts;
- comparisons.
Instead of seeing:
1,200 transactions
you see:
Gross Margin: 41.8%
That is much easier to act on.
Why Service Businesses Need a Financial Dashboard
Service businesses are operationally complex.
Money moves through:
Lead
↓
Booking
↓
Technician
↓
Job
↓
Invoice
↓
Payment
Problems at any stage affect financial performance.
For example:
Poor scheduling can reduce:
- technician utilization.
Low utilization can reduce:
- revenue.
Lower revenue can reduce:
- gross profit.
Lower gross profit can create:
- cash pressure.
A dashboard helps connect these issues.
A Dashboard Should Answer Questions
Do not add metrics because:
Other companies track them.
Every metric should answer a business question.
For example:
Revenue
Question:
Are we generating enough sales?
Gross Margin
Question:
Are jobs priced and delivered profitably?
Cash Balance
Question:
Do we have enough liquidity?
Accounts Receivable
Question:
Are customers paying quickly enough?
Technician Utilization
Question:
Are we using field capacity efficiently?
A useful dashboard is:
decision-focused.
Start With Three Dashboard Levels
A strong service-business reporting system can have:
Level 1 — Owner Dashboard
High-level financial health.
Level 2 — Operations Dashboard
Technician and capacity metrics.
Level 3 — Detailed Reports
Job-level, customer-level, and service-level analysis.
The owner dashboard should remain simple.
KPI 1: Revenue
Start with total revenue.
Example:
Revenue This Month: £120,000
Compare it against:
- budget;
- previous month;
- same month last year.
Revenue Example
Current:
£120K
Budget:
£125K
Variance:
−£5K
Previous month:
£108K
Year-on-year:
+14%
Now you know much more than:
Revenue = £120K.
Track Revenue Trend
Use:
- 6-month;
- 12-month chart.
Look for:
- growth;
- seasonality;
- decline.
A single month can be misleading.
KPI 2: Revenue by Service
Break revenue into:
- repairs;
- maintenance;
- installations;
- commercial;
- recurring services.
Example:
Repairs:
£35K
Maintenance:
£20K
Installations:
£45K
Commercial:
£20K
This reveals service mix.
Why Service Mix Matters
Two months can both generate:
£120K
but with different profitability.
Month A
Mostly repairs.
High margin.
Month B
Mostly installations.
Lower margin.
Same revenue.
Different gross profit.
That is why service mix belongs on the dashboard.
KPI 3: Gross Profit
Formula:
Revenue − Direct Costs = Gross Profit
Example:
Revenue:
£120K
Direct costs:
£70K
Gross profit:
£50K
Gross profit shows how much remains to cover:
- overhead;
- profit.
KPI 4: Gross Margin
Formula:
Gross Profit ÷ Revenue × 100
Example:
£50K ÷ £120K:
41.7%
Track:
Budget Margin: 43%
Actual Margin: 41.7%
Variance: −1.3 points
Small margin changes can have a large financial effect.
Gross Margin Trend
Example:
January:
43%
February:
42%
March:
40%
April:
38%
Revenue may still be growing.
But margin is deteriorating.
The dashboard should make that visible quickly.
KPI 5: Operating Profit
Operating profit shows what remains after:
- direct costs;
- overhead.
Example:
Gross profit:
£50K
Operating expenses:
£38K
Operating profit:
£12K
This is one of the most important owner-level metrics.
KPI 6: Operating Margin
Formula:
Operating Profit ÷ Revenue × 100
Example:
£12K ÷ £120K:
10%
This lets you compare:
- different months;
- growth periods.
Revenue Can Grow While Operating Margin Falls
Example:
Last Year
Revenue:
£100K
Operating profit:
£12K
Margin:
12%
This Year
Revenue:
£140K
Operating profit:
£10K
Margin:
7.1%
Revenue increased.
Profitability weakened.
A dashboard should make this impossible to miss.
KPI 7: Current Cash Balance
Show actual available business cash.
Example:
Current Cash: £82,000
But do not stop there.
Also show:
- reserve target;
- upcoming commitments.
KPI 8: Cash Reserve
Example:
Current reserve:
£58K
Target:
£75K
Coverage:
1.9 months
Status:
Below Target
This gives the bank balance context.
KPI 9: Lowest 13-Week Forecast Cash
One of the strongest dashboard metrics is:
Forecast Lowest Cash Point
Example:
Current cash:
£82K
Lowest forecast:
£31K
Minimum safe level:
£40K
Status:
Warning
Today’s bank balance looks healthy.
Future cash does not.
That is why forecasting matters.
KPI 10: Cash In vs Cash Out
Show monthly:
Cash In: £105K
Cash Out: £112K
Net:
−£7K
This explains whether the bank balance is:
- increasing;
- decreasing.
KPI 11: Accounts Receivable
Show:
Total Outstanding: £68K
Then age it.
Current
£35K
1–30 Days Overdue
£15K
31–60
£10K
61–90
£5K
90+
£3K
This immediately shows collection risk.
KPI 12: Overdue Receivables Percentage
Formula:
Overdue Receivables ÷ Total Receivables × 100
Example:
Total:
£68K
Overdue:
£33K
Overdue percentage:
48.5%
That deserves attention.
KPI 13: Average Days to Payment
Track how long customers take to pay.
Example:
Current average:
22 days
Previous:
16 days
Customers are paying more slowly.
Even if revenue stays healthy:
cash flow may weaken.
KPI 14: Break-Even Revenue
Display:
Monthly Break-Even: £92K
Current revenue:
£120K
Break-even coverage:
130%
This gives management a useful benchmark.
Break-Even Coverage Formula
Actual Revenue ÷ Break-Even Revenue
Example:
£120K ÷ £92K:
1.30x
or:
130%
The business is operating:
30% above break-even revenue.
KPI 15: Budget vs Actual Revenue
Example:
Budget:
£125K
Actual:
£120K
Variance:
−4%
Use:
- green;
- yellow;
- red
indicators.
KPI 16: Budget vs Actual Gross Margin
Budget:
43%
Actual:
41.7%
Variance:
−1.3 points
This may be more important than a small revenue miss.
KPI 17: Budget vs Actual Operating Profit
Budget:
£15K
Actual:
£12K
Variance:
−£3K
Now ask:
why?
Possible reasons:
- revenue below target;
- margin weak;
- overhead high.
KPI 18: Revenue per Technician
Formula:
Field Revenue ÷ Technician Count
Example:
Field revenue:
£120K
Technicians:
6
Revenue per technician:
£20K
This links finance with capacity.
KPI 19: Gross Profit per Technician Hour
Example:
Gross profit:
£50K
Productive hours:
600
Gross profit per technician hour:
£83.33
This helps management understand field profitability.
KPI 20: Technician Utilization
Formula:
Productive Hours ÷ Available Hours
Example:
Productive:
600
Available:
840
Utilization:
71.4%
This helps explain capacity.
KPI 21: First-Time Fix Rate
Example:
93%
A declining first-time fix rate can lead to:
- callbacks;
- lost capacity;
- lower margin.
It belongs on the operations section of the financial dashboard.
KPI 22: Callback Rate
Example:
2.8%
Add:
Callback Cost This Month: £3,400
That turns a quality problem into a financial number.
KPI 23: No-Show Cost
Example:
Appointments missed:
14
Technician hours lost:
18
Estimated lost capacity:
£2,700
Now the no-show issue becomes visible financially.
KPI 24: Marketing Spend
Show:
Marketing Spend: £8,000
But do not track spend alone.
Also show:
- leads;
- customers;
- gross profit generated.
KPI 25: Customer Acquisition Cost
Formula:
Marketing + Sales Cost ÷ New Customers
Example:
Marketing:
£8K
New customers:
80
CAC:
£100
This will be especially useful in a future dedicated article.
KPI 26: Customer Lifetime Value
If available:
show:
Average Customer Lifetime Value: £1,850
Then compare:
LTV:CAC
Example:
£1,850 ÷ £100:
18.5:1
Use caution with assumptions.
Customer lifetime value should be based on actual retention and margin data.
KPI 27: Payroll as a Percentage of Revenue
Formula:
Payroll ÷ Revenue × 100
Example:
Payroll:
£38K
Revenue:
£120K
Payroll percentage:
31.7%
Track over time.
This can reveal whether labor costs are growing faster than revenue.
KPI 28: Vehicle Cost as a Percentage of Revenue
Example:
Vehicle costs:
£9K
Revenue:
£120K
Vehicle percentage:
7.5%
This can help evaluate:
- fleet efficiency.
KPI 29: Marketing as a Percentage of Revenue
Example:
Marketing:
£8K
Revenue:
£120K
Marketing percentage:
6.7%
Again:
do not judge only by percentage.
If marketing creates strong gross profit:
higher spend may be worthwhile.
KPI 30: Revenue per Van
Example:
Field revenue:
£120K
Active vans:
6
Revenue per van:
£20K/month
This can help evaluate fleet investment.
Build an Owner Dashboard With 10 Core Metrics
You do not need all 30 on the main screen.
A practical owner dashboard can show:
- Revenue
- Gross Margin
- Operating Profit
- Cash Balance
- Cash Reserve
- Accounts Receivable
- Break-Even Revenue
- Lowest 13-Week Cash
- Revenue per Technician
- Gross Profit per Tech Hour
Then link to detailed dashboards.
Example Owner Dashboard
Revenue: £120K
Gross Margin: 41.7%
Operating Profit: £12K
Cash: £82K
Reserve: £58K / £75K target
Receivables: £68K
Overdue: £33K
Break-Even: £92K
13-Week Low: £31K
Revenue / Tech: £20K
GP / Tech Hour: £83
Now the owner can understand the business in under one minute.
Use Status Indicators
Example:
Green
Healthy.
Yellow
Needs attention.
Red
Action required.
Example:
Cash Reserve
Current:
£58K
Target:
£75K
Status:
Yellow
13-Week Low
£31K
Minimum:
£40K
Status:
Red
This makes the dashboard actionable.
Do Not Use Colors Without Thresholds
Red should mean something.
Define:
what triggers red?
Example:
Gross margin target:
42%
Green:
42%+
Yellow:
38–41.9%
Red:
below 38%
Illustrative only.
Use thresholds appropriate to your business.
Dashboard Should Show Trends
Current number:
Gross Margin 40%
Is that good?
It depends.
If last month:
45%
the trend is concerning.
Show:
- current;
- previous;
- target.
Example Trend Card
Gross Margin
Current:
40%
Previous:
43%
Target:
42%
Change:
−3 points
That tells a story.
Dashboard Should Show Variance
Example:
Revenue
Budget:
£120K
Actual:
£110K
Variance:
−£10K
Marketing
Budget:
£6K
Actual:
£8K
Variance:
+£2K
Now management can investigate the biggest differences.
Drill Down From Company to Service
If gross margin is weak:
do not stop at:
Company Margin: 37%.
Open:
Repairs
52%
Maintenance
48%
Installations
22%
Now you know:
installations are pulling the average down.
Drill Down From Service to Job
Installation margin weak.
Open recent jobs.
Example:
Job #1082
Quoted margin:
35%
Actual:
18%
Cause:
- labor overrun;
- extra materials.
This turns dashboard data into operational action.
Drill Down From Revenue to Technician
Revenue weak.
Ask:
- demand problem?
- utilization problem?
- job-value problem?
Dashboard should allow you to see:
Revenue per Technician
and:
Utilization
together.
Example
Revenue per technician:
£17K
Target:
£22K
Utilization:
54%
Likely issue:
- unused capacity.
If utilization were:
82%
the issue might instead be:
- low pricing;
- weak average job value.
Build a Financial Dashboard Hierarchy
Top Level
Business health.
Second Level
Revenue / profitability / cash / operations.
Third Level
Service / technician / job / customer.
This prevents the top dashboard from becoming cluttered.
Update Frequency by Metric
Not every metric needs real-time updates.
Daily
- cash;
- appointments;
- revenue booked.
Weekly
- technician utilization;
- revenue;
- callbacks.
Monthly
- gross margin;
- operating profit;
- budget variance.
Quarterly
- customer lifetime value;
- strategic trends.
Use a sensible cadence.
Do Not Obsess Over Real-Time Profit
Accounting data may require:
- invoices;
- payroll;
- material costs.
A real-time profit dashboard can be misleading if costs have not been posted yet.
Accuracy matters more than constant refreshing.
Source Data Matters
A beautiful dashboard with bad data is dangerous.
Make sure:
- jobs are closed correctly;
- technician hours are recorded;
- invoices are accurate;
- material costs are captured.
Dashboard quality depends on data quality.
Create Metric Definitions
Document exactly what each metric means.
Example:
Productive Hours
Includes:
- on-site work;
- job documentation.
Excludes:
- travel;
- lunch;
- training.
If different managers use different definitions:
the KPI becomes unreliable.
Create One Source of Truth
Avoid:
Accounting software says:
£120K revenue
CRM says:
£130K
Spreadsheet says:
£125K
Decide which system is authoritative for each metric.
Example:
Revenue
Accounting software.
Technician Hours
Field-service platform.
Leads
CRM.
This prevents confusion.
Automate Data Where Practical
Manual spreadsheets work initially.
But as the company grows:
automation can reduce:
- errors;
- reporting time.
Possible data connections include:
- accounting;
- CRM;
- field service software.
Do not automate a broken metric definition.
Define first.
Automate second.
Spreadsheet Dashboard for Small Businesses
A small service business can start with:
Google Sheets or Excel.
Tabs:
1. Financial Data
Revenue, costs, profit.
2. Cash
Bank balance, receivables, forecast.
3. Operations
Technician metrics.
4. Dashboard
Charts and KPIs.
You do not need expensive BI software immediately.
Recommended Monthly Dashboard Layout
Top Row — Financial Health
Revenue
Gross Margin
Operating Profit
Cash
Second Row — Cash & Risk
Receivables
Cash Reserve
Break-Even
13-Week Low
Third Row — Field Performance
Revenue / Tech
GP / Tech Hour
Utilization
Callback Rate
This gives a clean structure.
Add a “What Needs Attention?” Section
Do not make the owner interpret everything manually.
Example:
ATTENTION REQUIRED
- Cash reserve below target by £17K.
- Installation margin fell to 24%.
- Accounts receivable over 60 days reached £15K.
- Technician utilization dropped to 63%.
This is more useful than 50 charts.
Add a “Wins” Section
Also show positive changes.
Example:
WINS
- Repair margin +4 points.
- Callback rate down 1.2 points.
- Revenue per technician +8%.
- Overdue invoices down £9K.
This gives balanced visibility.
Add Monthly Action Items
Dashboard should lead to decisions.
Example:
Issue
Installation margin:
24%.
Action
Review last 10 installation jobs.
Owner
Operations Manager.
Deadline
Friday.
Metrics without action do not improve anything.
Use a Weekly Executive Scorecard
A shorter weekly view could show:
Revenue
Booked Revenue
Cash
Utilization
Callbacks
Receivables
13-Week Cash Warning
This helps owners stay informed without waiting for month-end.
Example Weekly Scorecard
Revenue WTD:
£28K
Monthly target progress:
47%
Technician utilization:
73%
Callbacks:
2
Cash:
£74K
Overdue receivables:
£21K
Forecast status:
Green
Simple.
Create Monthly Financial Review Questions
Ask:
- Did revenue hit budget?
- Did gross margin hit target?
- Which service had the weakest margin?
- Did overhead exceed budget?
- Did cash increase or decrease?
- Are receivables growing?
- Did reserve improve?
- Are technician metrics healthy?
- What requires action next month?
That keeps financial meetings focused.
Dashboard Example: Healthy Business
Revenue: £130K ↑
Gross Margin: 44% ✓
Operating Profit: £17K ✓
Cash Reserve: 2.5 months ✓
Receivables: stable
Technician Utilization: 76%
Callbacks: 1.8%
Looks healthy.
Dashboard Example: Busy but Weak Business
Revenue: £150K ↑
Gross Margin: 28% ↓
Operating Profit: £2K
Cash: falling
Receivables: increasing
Utilization: 85%
This business is busy.
But financially weak.
The dashboard exposes the difference.
Dashboard Example: Profitable but Cash Tight
Revenue: £120K
Operating Profit: £14K
Cash: £25K
Receivables: £90K
13-Week Low: £8K
Issue:
customers are not paying quickly enough.
Profit is not the immediate problem.
Collections are.
Dashboard Example: Underutilized Team
Revenue:
£95K
Margin:
45%
Technicians:
6
Utilization:
52%
Cash:
healthy.
Issue:
too much technician capacity for current demand.
Possible actions:
- improve marketing;
- reduce schedule gaps;
- delay hiring.
Do Not Track Vanity Metrics
Examples:
Total website traffic
may be useful for marketing.
But it does not necessarily belong on the owner finance dashboard.
Keep the dashboard focused on metrics that drive:
- profit;
- cash;
- capacity.
Avoid Dashboard Overload
A dashboard with:
60 KPIs
is not useful.
You should be able to look at the main screen and answer:
Is the business healthy?
within:
one minute.
Put detail behind the main view.
Common Dashboard Mistakes
Too Many Metrics
Creates noise.
No Targets
You do not know if performance is good.
No Trends
Current number lacks context.
Bad Data
Dashboard becomes misleading.
No Cash Metrics
Profitability alone is incomplete.
Revenue-Only Focus
Margin disappears.
No Operations Data
Financial results cannot be explained.
No Actions
Numbers do not lead to decisions.
Definitions Keep Changing
Comparison becomes unreliable.
Dashboard Is Never Reviewed
Then it is just decoration.
Financial Dashboard Checklist
Make sure your dashboard includes:
- Revenue
- Revenue vs budget
- Gross profit
- Gross margin
- Operating profit
- Cash balance
- Cash reserve
- 13-week lowest cash
- Accounts receivable
- Overdue receivables
- Break-even revenue
- Revenue per technician
- GP per technician hour
- Technician utilization
- Callback rate
- First-time fix
- Targets
- Trends
- Variances
- Action items
Sources and Further Reading
These official resources back up the methods in this guide and are worth reading alongside it.
- Manage your finances (U.S. Small Business Administration): bookkeeping, financial statements and cash flow basics.
- Publication 583: Starting a Business and Keeping Records (IRS): recordkeeping basics for small businesses.
Related guides
- How to Calculate Break-Even Revenue for a Service Business
- How to Price Service Jobs Without Guessing: Labor, Materials, Overhead & Profit
- Tools, Software and Automation for Trades: Start Here
Frequently Asked Questions
What should be on a service business financial dashboard?
A strong owner dashboard usually includes:
- revenue;
- gross margin;
- operating profit;
- cash;
- receivables;
- break-even;
- technician performance.
How many KPIs should a dashboard have?
There is no universal number, but the main dashboard should remain simple enough to understand quickly.
Around:
8–12 core metrics
is often practical.
Should revenue be the main KPI?
Revenue is important, but not enough by itself.
Also track:
- margin;
- profit;
- cash.
Should technician KPIs be on a financial dashboard?
Yes, at a high level.
Technician performance directly affects:
- revenue;
- margin;
- capacity.
How often should a dashboard update?
Different metrics need different frequencies.
Operational metrics may update:
- daily;
- weekly.
Financial metrics are often reviewed:
- monthly.
Can I build a dashboard in Excel or Google Sheets?
Yes.
Many small businesses can start effectively with a spreadsheet.
What is the most important cash metric?
Useful cash metrics include:
- current cash;
- reserve;
- 13-week lowest forecast cash.
Should accounts receivable be included?
Yes.
Unpaid invoices can create serious cash pressure even when revenue and profit look healthy.
What is a good dashboard color system?
A simple:
Green / Yellow / Red
system works well when thresholds are clearly defined.
What makes a financial dashboard useful?
It should lead to:
decisions and action.
If nobody uses the numbers:
the dashboard is not doing its job.
Conclusion
A financial dashboard for a service business should help the owner understand the health of the company quickly.
Do not build a dashboard that only says:
Revenue is up.
Build one that shows:
Revenue
↓
Gross Margin
↓
Operating Profit
↓
Cash
↓
Receivables
↓
Break-Even
↓
Technician Capacity
For example:
Revenue:
£120K
Gross Margin:
41.7%
Operating Profit:
£12K
Cash:
£82K
Receivables:
£68K
Break-Even:
£92K
Revenue per technician:
£20K
Gross profit per tech hour:
£83
Now you can ask:
Where is the business strong?
Where is risk increasing?
What needs action?
The best dashboard does not contain the most numbers.
It contains the right numbers.
And every important KPI should connect to a decision:
Revenue weak?
Check demand.
Margin weak?
Check pricing and job costs.
Cash weak?
Check collections and forecast.
Technician production weak?
Check utilization and service mix.
That is how a dashboard becomes more than a report.
It becomes a management system.